
Wikivoyage talk:How to draw static maps/Archive 2006-2012
| This is an archive of past discussions. Do not edit the contents of this page. If you wish to start a new discussion or revive an old one, please do so on the current talk page. |
This is very, very heavily based on Image talk:Paris.svg, by Wikivoyage's resident map-master Mark. (WT-en) Jpatokal 06:29, 1 Jan 2006 (EST)
- Thanks a lot for this. I am trying out some stuff and it is surprisingly easy. --(WT-en) Ravikiran 00:10, 3 Jan 2006 (EST)
- Please add in any feedback. I'd also like to develop a "palette" of standard symbols etc to set a standard and enable drag'n'drop easy map creation. (WT-en) Jpatokal 00:43, 3 Jan 2006 (EST)
- On the basis of reading this article, I have been playing around with Map Making using InkScape and it is remarkably easy to get the hang of (though haven't had the patience to build a complete city map just yet). One problem though - I followed the link to the Blue Highway font but am unable to see where to download it for free from. Can someone who knows update the link to a more suitable site please?
- Also, I am in the process of developing a template SVG, based on jpatokal's Singapore map, which groups the different types of graphic (e.g. street, label, buildings) into distinct layers so that a user can copy and paste the elements and not need to draw from scratch / worry about setting colors etc. Once I get the font issue sorted out (above) I will post this template on the Expedition page. --(WT-en) Stuart Edwards 19:52, 7 Jan 2006 (GMT+10).
- I found a free one here . --(WT-en) Ravikiran 04:18, 7 Jan 2006 (EST)
- Regarding the template, please use Mark's Lausanne map as a base instead, he's much better at this stuff than I am. (WT-en) Jpatokal 05:10, 7 Jan 2006 (EST)
Rights to Google Earth
Mark, I don't understand your deletion -- Google hasn't copyrighted the planet, why do you think using their satellite data for mapmaking is not within our 'rights'? As long as the data is not visible in or attached to the image, I don't see what the issue could possible be. (WT-en) Jpatokal 22:15, 13 Feb 2006 (EST)
- Sadly although Google has no copyright to the Earth the people who supply them with photographs and map data do have copyright to those images and that data. Taking a photo of the Earth is no different whatever in the eyes of the law from taking a photo of a building. The photo belongs to the photographer.
- There's a longer explaination over at OpenStreetMap if you don't believe me.
- No, I understand that the photographs are copyrighted, that's not the issue. (WT-en) Jpatokal 01:26, 14 Feb 2006 (EST)
- Now that said, the data itself (ie. where the streets of a town are) is not subject to copyright, but there is and unfortunate "database" right in European law. Still I think it would be awfully difficult to prove that a given map was traced from a given aerial photo unless of course the map were to appear in a project where it's suggested that people use photos from a given source. So I think it's best we not do that.
- The link above says that whether derived works (eg. a map) from aerial photography are allowed or not is still disputed. However, I don't think the EU's database rights can be stretched to include raw, unannotated satellite imagery, or otherwise I could argue that any digital picture is a "database" of pixels. (WT-en) Jpatokal 01:26, 14 Feb 2006 (EST)
- I think you're underestimating how hard the map data companies are likely to fight. They make it very clear in their terms that they believe that they have the rigth to limit derivative works. Of course I'd welcome a favorable resolution, but I don't really want to put my energy and resources into the test case. You? -- (WT-en) Mark 02:01, 14 Feb 2006 (EST)
- A further word of advice: aerial photos often introduce subtile distortions since they are rarely taken from an exact plum line position above the subject area. Therefore it's necessary to apply some skew to the photo before starting to trace streets in order to make it match a local map projection more closely. This skew if done with a little artistic license can pretty much totally break any possibility of proving a particular photo was traced. Not that I'm saying anybody should disrespect any photographer's rights of course. -- (WT-en) Mark 00:31, 14 Feb 2006 (EST)
Using NASA Worldwind solves the copyright problem by using only public-domain data. It's currently Windows-only, but being ported to Java. -- (WT-en) Colin 02:29, 15 February 2007 (EST)
Yahoo aerial photos
- There's another cool bit of news on http://openstreetmap.org. I haven't had time to look into it myself, but it looks like Yahoo has gifted their aerial photography to the project. -- (WT-en) Mark 12:33, 15 February 2007 (EST)
- Here's the OpenStreetMap page in question -- (WT-en) Mark 08:39, 16 February 2007 (EST)
Metro/rapid transit lines
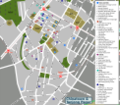
I have been using a solid blue line, as thin a possible, for rapid transit lines (0000ffff) as it seems to stand out from all the other map colours used. For above ground stations I use the same colour, in a rectangle or whatever in roughly the shape and size of the station. For underground stations I use a small blue circle. Annotations are also blue, in very small italic text (Arial) to stand out, and make it obvious the annotation is attached to the station. I wonder if underground lines should be dashed, and surface level/above ground lines solid, or if it matters. I am throwing this out here to guage some opinion, and see if anyone can agree to standardize how to represent metro lines in our maps. For examples see the maps in Vancouver/City Center, Toronto/Downtown and Toronto/The Annex. - (WT-en) bulliver 00:51, 15 March 2006 (EST)
- For Singapore, I've been using a thin dotted red line (for underground sections) and the station symbol copied directly from Mark's Paris map. I'm not entirely happy with it though, both are a bit too small. (WT-en) Jpatokal 01:20, 15 March 2006 (EST)
- I really like the way both of your sets of maps look, including the rapid transit lines.
- The Metro symbol on the Paris map is a caracature of the Métro logo, I would imagine it to be sort of Paris specific. I agree that it would be better for it to be a bit bigger. For Lausanne I used an uppercase M in Courier Bold, which is the logo of their Metro system.
- As for the routes, I haven't done them yet for Paris, but I've been stuck on the 18th for about a year... I keep meaning to get back to it. For Lausanne I used red for M2 and blue for M1 which is what the city uses. -- (WT-en) Mark 03:08, 15 March 2006 (EST)
- So can I draw from this then that we should _not_ standardise, and rather try to coordinate the colours with the official maps depending on the city? - (WT-en) bulliver 17:21, 17 March 2006 (EST)
- No, I think we should standardize. I think transit maps (big lines, bright colors, simplified routings) and transit lines on street maps (station locations in detail, but connections just thinly dotted) should be kept distinct. (WT-en) Jpatokal 23:38, 17 March 2006 (EST)
- The only problem is that transit lines in many cities are color coded, so if we don't use their colors it could be confusing for people trying to use the transit system, even if it results in prettier maps. I suppose use of the local color-coding is most important for the schematic transit maps than it is for street maps. -- (WT-en) Mark 02:20, 18 March 2006 (EST)
- I guess I should have made clearer, in the above I was talking only about our city/district road maps. I full-on agree the subway/metro schematic maps should be colour coded as per the official lines. -- (WT-en) bulliver 03:19, 18 March 2006 (EST)
- I think I do agree with you guys. After all one of the reasons that I haven't added metro traces to the Paris map is that I hadn't resolved this question in my own mind. I'm also thinking that it would be good to come up with a common metro symbol. I'm afraid that the Parisian "M" could be confusing where the metro is called something like "The subway" or "The El" or "U-Bahn". In SF for instance there are two systems, one of which is called "Metro" and the other of which is "Bart". -- (WT-en) Mark 03:31, 18 March 2006 (EST)
- Just thought I'd chip in to say that I've done symbols for light rail and underground rail stations and added them to Project:Common map symbols. Hopefully the underground symbol should solve the above problem. --(WT-en) Paul. 23:31, 6 October 2006 (EDT)
Altitude into map scale?
My turn to ask a question — how can I convert Google Maps' "eye altitude" into the scale of the map? (WT-en) Jpatokal 13:05, 4 April 2006 (EDT)
- Are you talking about Google Earth? If so, it has a measuring tool (it's on the menu) that will tell you how far it is between two points. - (WT-en) Todd VerBeek 13:39, 4 April 2006 (EDT)
Isle Royale map
I started by capturing a satellite image of the island, and used Adobe Illustrator's Live Trace function to approximate the shoreline. (Inkscape has a trace feature too, but I've never used it.) I had to play around a bit with the settings to get something that got the shape right, and then simplified it to two colors. I ended up having to do a lot of smoothing and tweaking (such as reconnecting peninsulas to the mainland or separating inland lakes), so it might have been easier to trace it by hand (which is what I'm doing for my map of Sleeping Bear Dunes... which is also a simpler shoreline). As it is, most of the little details, such as the curvature of a small peninsula or inlet, were made up by Illustrator trying to interpret and simplify a pixelated satellite image. But I figure if some hiker really needs to know the geography, they'll get a professionally-made map.
From there it was mostly a matter of drawing the trails in (using a couple maps as reference and taking care not to try to be too detailed), adding symbols and labels, etc. I put each major kind of element (e.g. the land, the trails, campsites, geographic labels) on its own layer to make it easier to manage them. I did all the work in Illustrator, then exported to SVG (which flattens everythign to one layer). I used Photoshop to import the Illustrator file, then scale it, crop it, and export it to PNG. (GIMP could've done the same with the SVG file.) Hope this helps. - (WT-en) Todd VerBeek 11:22, 6 April 2006 (EDT)
Help me export my new map
I created it with Inkscape, but .png is apparently not one of the export options. It's all finished except for cropping and exporting. (can't figure out how to crop either) Took me all day to make this silly map and now I can't figure out what to do with it. Can someone please help me? (WT-en) Texugo 07:27, 8 August 2006 (EDT)
- Here's what I've got so far. I need to trim the extra white space around the edges, as well as the extra grey box, then I need to export it to a different file format and re-upload it to wikivoyage.
- In my Inkscape it's just "File -> Export bitmap" and it'll automatically save as PNG. To crop, select a correctly-sized object and choose "Selection" in the export dialog. You sure you're not hunting for PNG under "Save as...", which only saves vector graphics? (WT-en) Jpatokal 08:25, 8 August 2006 (EDT)
- thanks a lot.. Yeah, it was something like that.
- Great looking map, by the way! (WT-en) Jpatokal 08:34, 8 August 2006 (EDT)
How to obtain satellite images
Hi guys,
I have a very simple question. Reading this help page, I see:"The first step is to obtain satellite imagery of your chosen location".
Ok, very easy, I thought. I choose a location (done) and I want to obtain satellite imagery. But... can someone explain me how to do this??? Because I still do not understand how to do it!!! Is there any webpage where I can just take the satellite images?
I guess there isn't. So If images from sites like GoogleMaps are copyrighted, how can I do this? Do you expect people taking a space shuttle and take pictures from the space? ☺
I hope someone can explain me this a little bit. Thanks84.160.214.30 17:17, 4 October 2006 (EDT)
- You can just use Google Maps or Google Earth, or any other mapping site. While the maps are copyrighted that doesn't mean you can't use them as a guide for creating your own maps. --(WT-en) Paul. 23:33, 6 October 2006 (EDT)
I think that this section of the article could really use some beefing up - what are the best sources for satellite imagery available? For much of the world Google Earth/Maps is not an option because it won't render most non-Western countries in sufficient detail. I'd really like to plunge forward on making some maps of principal cities in the Caucasus, but without the satellite images, the rest of this article isn't going to help! --(WT-en) Peterfitzgerald 17:59, 4 March 2007 (EST)
Map Template
Having a map template in shared will make map drawing easier and help to keep maps more consistent. At a minimum it should contain a number of layers: greyback (with a grey background), oceanback (with a blue background), tempback (for temporary satellite imagery), object area (blank, to be used for the main outline of the city/park etc), roads(blank), water(blank), mayor cities(blank), minor cities(blank), annotation (with a standards sidebar, WT logo etc), spare parts (with all the objects from Project:Common_map_symbols correctly colored). An additional layer with hints and help text might also be a good idea. Project:How_to_draw_a_map can then be adapted to refer to the layers and objects already in this template, making those instructions a lot easier to follow for new map builders. I'll start putting one together, but any additional input will be useful. --(WT-en) NJR_ZA 00:39, 20 February 2007 (EST)
- Jpatokal, just noticed that you have already started a template. I'll build on the work you have already done thanks.
Cincinnati map
Things identified for fixing on Project:How to draw a map
- Don't tell people to delete the Spare parts layer, it should stay so it can still be used during future edits to the map.
The maps refered to during this discussion
- Image:Map-USA-Cincinnati01.svg - MapA - Created using Inkscape (version 0.44 on windows), traced from an existing map.
- Image:Cincinnati map.svg - MapB
(WT-en) Sapphire, I was rather taken by surprise by a couple of things you have done here, but that is a good thing; if you let me pick your brain we will be able to use that info to improve Project:How to draw a map.
First questions:
- What software are you using?
- You decided to create a new svg file (MapB) rather than just updating and re-uploading the one I prepared (MapA). What was the reasoning behind that?
- I only see 3 layers in MapB. That makes the map is bit less generic and flexible. With multiple layers one can export different types of png maps (depending on requirements) by switching visibility on different layers on or off, i.e. if one only need a street map one can switch off all annotations etc. Is there a specific reason why you would like fewer layers?
--(WT-en) NJR_ZA 02:41, 7 March 2007 (EST)
- Inkscape (Latest version)
- I still have Image:Map-USA-Cincinnati01.svg, however, because of the problems I was running into I created the latter image to mess around with it, rather than mess up the map saved under the original name.
- I actually added layers, for whatever reason Inkscape wasn't showing all of the layers. I know there were additional ones because several random clicks would display the name of the layer I was working on, but if I went back to working on a different layer, then the others would disappear and would not be listed in the layers box. -- (WT-en) Sapphire • (Talk) • 13:46, 7 March 2007 (EST)
- OK, I think I might be on an older version of Inkscape. Left my laptop at work, but I'll check tomorrow and see what I am running. The problem might be with the version you are using. I also had a problem accessing the layer containing the streets on MapB. Might be that your version of Inkscape was messing the file. --(WT-en) NJR_ZA 15:22, 7 March 2007 (EST)
- I'm on version Inkscape version 0.44 on windows. I have added your annotations to Image:Map-USA-Cincinnati01.svg and re uploaded it. I have also uploaded a screenshot of the map open in Inkscape showing all the levels that you should be able to see [[:Image:Wikivoyage-how_to_draw_a_map_Cincinnati_test.png]]. Won't you try and open it and see if it works now? --(WT-en) NJR_ZA 02:18, 8 March 2007 (EST)
Region maps
This article does a good job as a guide for city maps, but what about region/country maps? Are there any standards that Wikivoyage encourages for region maps? Any tips on how to create them effectively? --(WT-en) Peterfitzgerald Talk 15:48, 21 April 2007 (EDT)
- I was sooo struggling with the same thing last night. I would start by checking out (WT-en) Nick's maps for South Africa, I think those look pretty great. He made 1 svg file, and then all of the various regions are different layers. I'm still trying to dissect a bit and figure out what's what, but would surely benefit from a little more how to... I have even more respect for you map makers now that I'm attempting it myself... it's a lot of friggin work! – (WT-en) cacahuate talk 01:56, 22 April 2007 (EDT)
- Some of those South African region maps are rather old, they were the first ones I started drawing and probably not the best. It is probably best to look at the newer ones: Image:Map-India-Goa01.png, Image:Map-USA-Regions01.svg and Image:Map-South_Africa-KwaZulu_Natal.svg seems to have worked quite nicely. --(WT-en) NJR_ZA 04:22, 22 April 2007 (EDT)
- Ah yeah, I was admiring your USA map earlier today when I was looking for models. What would be most useful for me is a breakdown of the major steps you would go through in creating a map like that, e.g., I assume you started by tracing a public domain map? Getting well defined subregion borders from traces (in Inkscape) is something I have been really struggling with. I'd like to redo my rather amateurish Russia#Regions map and have grandiose plans of creating maps further down Russia's geographic hierarchy, but I'd like to have a clearer idea of what I'm doing before I get too far ahead of myself. Thanks! --(WT-en) Peterfitzgerald Talk 04:33, 22 April 2007 (EDT)
- Most I trace, but the USA one I did not, I used a svg map from commons as a base to work from. You might find some license compatible work under SVG maps of Russia and SVG maps of the world that can save your the bother of haveing to redraw from scratch.
- A good tip for anyone that wants start drawing maps would to be avoid city maps and rather start with region maps. Region maps contain a lot less information and takes a heck of a lot less time to complete. [[:Image:(de)Map-USA-Manhattan01.png]] took me forever and it is still not complete. Entering hundreds of street names is boring repetitive business and one really need to be in the mood for braindead work to do it; Image:Map-India-Goa01.png on the other hand took me less than 2 hours in total.--(WT-en) NJR_ZA 04:58, 22 April 2007 (EDT)
- One more thing. Your Russia#Regions map is actually not bad, but you can make it look a lot more professional simply by reducing the width on the border strokes. --(WT-en) NJR_ZA 05:24, 22 April 2007 (EDT)
- I hate to bring this up, but it looks like the .svg base for your USA map is licensed under GNU — is it possible to use GNU svg files from Commons as a base for maps on this site? If so, that would save me a lot of time. --(WT-en) Peterfitzgerald Talk 10:28, 25 April 2007 (EDT)
- Hold on, I specifically used one that was Public Domain, that is why I also uploaded my USA region map under Public Domain rather than the usual CCSA 1.0. I did have a number of window open when I was looking for a map to use and it is possible that I copied the wrong url. I'll check which one I really used on my desktop when I get home. If I did mess up and used the GNU licensed one, then we will have to vfd the map and I'll redo it using one of the public domain maps as base. --(WT-en) NJR_ZA 11:33, 25 April 2007 (EDT)
- Damn, you are right, I messed up and based this map on GNU licensed work. I'm removing it from the article and will redo it over the weekend based on a Public Domain map () will do. Just audited myself quick as well and the only other 3 maps that I based on existing work (Hawaii, Africa and Time_zones) seems to be in the clear. --(WT-en) NJR_ZA 15:59, 25 April 2007 (EDT)
- Ah, that sucks. I'm sorry I had to be the one to break the bad news. --(WT-en) Peterfitzgerald Talk 16:30, 25 April 2007 (EDT)
Blue Highway Font
Seems the link to the Blue Highway font is broken again. Found an alternative here.
I think we need a page that hosts the Blue Highway fonts, something like Wikivoyage:Blue Highway font
It can contain the 4 ttf files (Blue Highway, Blue Highway (Bold), Blue Highway (Condensed), Blue Highway (D Type)) and Ray Larabie's readme.txt and licence for the fonts, installation instructions for Wikivoyage users and pointers as to when to use each of the fonts.
Who do I speak to in order to get .ttf files allowed for uploading for a short period of time in order to upload those?
--(WT-en) NJR_ZA 12:18, 30 April 2007 (EDT)
Automated tracing potrace vs. autotrace
copied in from User talk:Peterfitzgerald
I've been looking at autotrace and it seems to do a rather better job than potrace (the tracer embedded in inkscape). It has a centerline option that results in the output generating a path rather than an enclosed shape, exactly what you wanted earlier.
You might want to give this one a try.
Best results so far are on black and white images and they are not perfect yet, but definitely workable; I'll continue testing.
Command line options are quite easy to use \autotrace-0.31.1-w32>autotrace -output-file testout.svg -output-format svg -report-progress -centerline testin.gif
- I just ran a test over one of the maps you found using the following options:
- D:\Download\autotrace-0.31.1-w32>autotrace -output-file m.svg -output-format svg -report-progress -centerline -background-color fce0ec "\WikiTravel\maps\tmp\BlankMap-RussiaDistricts-Mercator.png"
- You can find the result at [[:Image:Map-Russia01.svg]]. Obviously the paths will have to be manually combined to create usable objects, but the trace looks rather good. This will save a heap of time. --(WT-en) NJR_ZA 09:54, 3 May 2007 (EDT)
- Scratch that, it get's better, way way better. Autotrace is far better than I ever expected any tracing program to be.
- I did some cleanup of the source png in the GIMP to make it a nice clean black and white image. Then I ran autotrace without the -centerline option and it was bright enough to create perfectly traced objects for each district. The command was simply: autotrace -output-file Russia02.svg -output-format svg -report-progress BlankMap-RussiaDistricts-Mercator-BW.png and I ended up with a nice svg that I imported into our template and created [[:Image:Map-Russia02.svg]].
- Because everything was so easy and working so nicely I then went ahead and coloured the regions as per your existing map. [[:Image:Map-Russia03.svg]]
- Autotrace rocks! --(WT-en) NJR_ZA 14:35, 3 May 2007 (EDT)
Hey, I wanna join the party! Am I right in seeing that it's only for Windows? If I have to manually trace another map I'm gonna have a meltdown... just finished Asia... uggghh.... – (WT-en) cacahuate talk 21:48, 4 May 2007 (EDT)
- My dream come true would be something similar to the magic wand tool in Photoshop... I don't have Adobe Illustrator (yet), but is there a similar tool there? Or is it possible to create the traces in Photoshop somehow and export them? I do see a "export paths to Illustrator" option in Photoshop, but I have no idea how to make use of it. There's got to be a simple and quick way to be doing these traces... seems like you guys are on the right road to discovering it, so I'm gonna sit back and wait for the magical answer to appear :) Anyone else got any ideas? And for the love of God, make your solution Mac compatible... – (WT-en) cacahuate talk 23:28, 4 May 2007 (EDT)
- Binaries are available from the site for linux and win32, but I don't see any mac version there. The source is however available, so you might be able to build from that, maybe use fink to assist in the build. fink does have autotrace listed in the unstable section, but that does not mean it will be unstable on your mac, it generally just means that they have not had enough feedback on it yet.
- The windows version crashed every time I tried autotrace --help, but other than that worked fine. On linux (kububtu) I had no issues.
--(WT-en) NJR_ZA 04:00, 5 May 2007 (EDT)
- Unfortunately everything you just said flew straight over my head, so I don't think that option is for me ;) I'm hoping to get Illustrator soon, and hoping that between it and Photoshop I can sort out a fast way of doing traces... hmmmm... – (WT-en) cacahuate talk 15:22, 5 May 2007 (EDT)
Online GUI
FYI, Autotrace now has an extremely user-friendly online GUI. The traces are pretty fantastic (as far as automated traces go), and it's very easy to at least try it out with the base image you are using. Cleaning it up to get what you want can be tough, but in certain circumstances will likely be easier than an actual trace. --(WT-en) Peter Talk 19:07, 3 April 2009 (EDT)
Asia map
Moved here from User talk:(WT-en) NJR ZA#Asia_map
I'm attempting to copy the sleek style used on the Texas#Regions page for the new map I just added to Asia#Regions, but it doesn't seem to be rendering the colors correctly... any ideas? – (WT-en) cacahuate talk 22:19, 4 May 2007 (EDT)
- I also stumbled about trying to do this yesterday. The problem is that Inkscape assigns values to colors for RGBA (i.e., red, green, blue, and A=opacity?, e.g., FFFFFFFF), whereas the colors you can specify in that table are limited to the 6-digit RGB (e.g., FFFFFF). So just getting rid of the last two digits of the color code from the svg when you input it into the wikitable should cause it to render the color correctly (e.g., ffe680ff --> ffe680). One other thing that (WT-en) Stacey brought up is that the colors you use should probably be html safe colors, although I'm not sure how important this really is. --(WT-en) Peterfitzgerald Talk 03:37, 5 May 2007 (EDT)
- That Asia#Regions map looks great. The last two color digits in Inkscape are indeed for opacity/transparency, generally you will just set them to ff. Sticking with html safe colors on the maps is a good idea if we intend to use the same colors in html as we use on the maps; that is the only way that you will be able to render the colors correctly. However, I don't think it is a very good idea to create complex tables and specify colors in the articles as was done on the Texas#Regions page, it looks good, but does make the page very difficult for most people to modify. Since we are a wiki and we want everyone to be able to contribute and make changes, we really should keep complex tables and html out of the articles. --(WT-en) NJR_ZA 03:51, 5 May 2007 (EDT)
- In general, I would agree with that, but I think for macro-level indexes like Asia, the html table might be appropriate because A. any changes to the regions layout should anyway be proposed first on the talk page and would not be possible without map-editing, which would be beyond the scope of what most editors are willing to do; B. we don't have one-line descriptive entries for each region (as we would with smaller, less known regions), which editors might want to modify. So, perhaps scrap the table for Texas, but use it for Asia and other macro level regions like Africa or Europe? --(WT-en) Peterfitzgerald Talk 13:20, 5 May 2007 (EDT)
- Yeah, I brought this up before at Wikivoyage_talk:Manual_of_style#Region_maps_.2F_color_key, I'd be happy to not use this style altogether as I don't think it's all that necessary... especially if we create a color key on the map itself, which we all seem to be doing. I think Nick's right, let's just keep it simple, clean and easy to edit! And then we don't have to worry about HTML colors, etc... easier on everyone... – (WT-en) cacahuate talk 15:06, 5 May 2007 (EDT)
- Though I just looked at Asia#Regions where Nick corrected the colors, and is does look pretty sexy... it's lonely up here on the fence... also then you can see the color and read the region names without clicking on the map (the text on the map is too small to see within the article) – (WT-en) cacahuate talk 15:17, 5 May 2007 (EDT)
- Yeah, I brought this up before at Wikivoyage_talk:Manual_of_style#Region_maps_.2F_color_key, I'd be happy to not use this style altogether as I don't think it's all that necessary... especially if we create a color key on the map itself, which we all seem to be doing. I think Nick's right, let's just keep it simple, clean and easy to edit! And then we don't have to worry about HTML colors, etc... easier on everyone... – (WT-en) cacahuate talk 15:06, 5 May 2007 (EDT)
- I agree that the big advantage to this scheme is that you don't have to click on the map—having to click the thumb seems like a big extra step that we shouldn't need. If we did get a template together for this purpose, I think that should put to rest html concerns. Although, I confess I don't know how to make said template ;) --(WT-en) Peterfitzgerald Talk 15:45, 5 May 2007 (EDT)
- Ah, yes, a template will remove my concerns as it will reduce the complexity again. I'll put one together for us. --(WT-en) NJR_ZA 16:38, 5 May 2007 (EDT)
I have added a template to draw the region list with colors Template:Regionlist. Africa#Regions has been updated to use the template. The color values can be either standard html color names or #RGB codes. --(WT-en) NJR_ZA 06:45, 7 May 2007 (EDT)
Increasing color contrast for better printing
Wikivoyage's maps look pretty enough on screen, but they print badly as black and white because too many colors have about the same lightness (on the hue-saturation-lightness scale). For white=255, black=0, the present template uses:
| Object | Now | Proposed |
|---|---|---|
| Road | 255 | 255 |
| Water | 181 | 180 + texture? |
| Footpath | 163 | 220 + dashes |
| Building | 141 | 120 |
| Park | 127 | 75 + texture? |
| Road names | 88 | 0 |
 Old
Old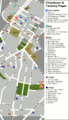 New
New


I've created a proposed template at [[:Image:Wikivoyage-map-template-hc.svg]] and Image:Singapore-Chinatown2.png uses the revised template. One thing I'd like to add is simple pattern textures to water (waves) and maybe park (trees?) to make them stand out more -- however, despite spending an embarrassingly long time trying to create tiled patterns with Inkscape, I couldn't make it work, nor could I find anything suitable on the Internet. Comments and help welcome! (WT-en) Jpatokal 09:40, 9 September 2007 (EDT)
- I think your high contrast maps looks far better than the existing temple, even on screen. --(WT-en) NJR_ZA 11:57, 9 September 2007 (EDT)
- Agreed. It looks great! I really like the texture idea. -- (WT-en) Mark 12:08, 9 September 2007 (EDT)
- This seems very sensible. Not looking forward to recoloring existing maps though ;) --(WT-en) Peter Talk 03:50, 10 September 2007 (EDT)
- Yeah, please go ahead! I'm waiting for the new guidance. -- (WT-en) Tatata 00:23, 12 September 2007 (EDT)
- One other color I'd like to see defined is our "sand" color. I'm not sure how many district articles will use this, but I've found it useful to have a different color to mark out the beaches in Chicago. I have been using #f8f27a - is that a good color to be using? See [[Image:South Chicago Shore]] for an example. --(WT-en) Peter Talk 22:08, 12 September 2007 (EDT)
- Easy test: export your file to PNG, then switch to "mode" to "grayscale".
- And turns out that the reason I was having problems with patterns in Inkscape wasn't me, but a bug in Inkscape that's been open for three years now and basically means pattern fills on non-white backgrounds don't work. Garr. (WT-en) Jpatokal 04:42, 15 September 2007 (EDT)
So, I eventually got the patterns to work by the simple expedient of create a huge block of pattern and ignoring the lines -- they look fugly on screen, but are pretty much invisible when printed.
Another bigger change is that I concluded that, alas, Blue Highway is not very clear when used at small resolutions. Instead, I've opted for Bitstream Vera Sans , which is not only very clear even at teeny sizes (especially when bolded), but is open source and comes bundled with most Linux and Windows distributions.
I've uploaded a new template on top of my previous one, comments welcome. Image:Singapore.svg has already been reworked to use it, and barring major uproar I'll make it the "official" WT template next week. (WT-en) Jpatokal 07:59, 23 September 2007 (EDT)
I've been unable to download the Singapore.svg file.--(WT-en) Peter Talk 13:53, 23 September 2007 (EDT)- Scratch that, it's available at [[:wts:Image:Singapore.svg]]. --(WT-en) Peter Talk 00:27, 25 September 2007 (EDT)
- The Bitstream Vera Sans font works wonderfully—the Blue Highway clarity problem had been a bit of a headache for me as it was. Just one objection to making this the "official" template, though. As of now we recommend the template that is fully Public Domain; this template uses icons that come with clunky attribution requirements per CC-by-SA. This recommendation was based on the discussion at Image_talk:Wikivoyage-map-template.svg. --(WT-en) Peter Talk 13:17, 25 September 2007 (EDT)
- Actually, there is a problem with Bitstream Vera Sans—its total lack of foreign alphabet support. I recommend we ditch it and use the identical DejaVu Sans, which does have additional alphabet support, instead. --(WT-en) Peter Talk 23:59, 3 August 2008 (EDT)
Railways
As long as we're trying to come up with new patterns, one other thing that has been on my mind is that it would be nice to show railways. What I think would work best is a patterned line that looks like a railroad track. I don't know how to do this, though. --(WT-en) Peter Talk 12:47, 12 September 2007 (EDT)
- I did that on the Pakistan map, it's pretty rough but you could make it look better if you took the time... see here. Just draw a regular line as you would a road, then in the "fill and stroke" box go down to the mid-markers pull down menu.. there's a few options that could look like a train track – (WT-en) cacahuate talk 23:46, 12 September 2007 (EDT)
- Thanks, that does work. Not perfectly though, since it's not really feasible to get all the mid markers to space evenly. I'll try this out with the map I'm currently working on. --(WT-en) Peter Talk 23:59, 12 September 2007 (EDT)
- For the original Paris maps way back when I just used a solid black line for railways. Of course that was way back when. -- (WT-en) Mark 16:47, 26 November 2007 (EST)
The starting map.
I thought of making a map of Pyin U Lwin but am stymied by the fact that the only two maps I can find are in LP and at a site online. I assume it is not ok to start tracing a map from the LP version, nor is it ok to do that with the online thing - so how does one start if there is no map to trace from? Or is there some half way thing I can do with existing maps that gives me a start on a new one?--(WT-en) Wandering 17:43, 13 September 2007 (EDT)
- If there's no decent satellite imagery online, there's not much you can do. (WT-en) Jpatokal 23:50, 13 September 2007 (EDT)
- Well, if you know the place well enough and have extremely high spacial intelligence, you might be able to make one off the top of your head. Failing that, any high-res overhead photo could work—helicopter shots? Another thing to look into are old Soviet maps, if you can find them. The Soviets produced some pretty incredible maps in their day and there are usable PD street maps available for cities/towns that were of especial strategic importance. Lastly, I think that if you were very careful about it, you could use several maps as a reference for creating a free-hand map, but you absolutely could not trace copyrighted maps. The only other thing I can think of is to check whether there are any maps made by any government agency or other group that might be willing to relicense a map to the public domain or CC-by-SA, and then shoot them an email. We managed to get such permission from the Swedish Embassy in Azerbaijan of all places. --(WT-en) Peter Talk 14:49, 14 September 2007 (EDT)
I could probably sketch out a map of the principle roads quite easily (using the other maps for reference). But, of course, such a map would not be to scale. Would that be consistent with wikivoyage's policies on maps?--(WT-en) Wandering 14:59, 14 September 2007 (EDT)
- An out of scale map is definitely better than no map, so I wouldn't worry about that. But perhaps it would be wise to wait a bit and see if anyone objects to a freehand drawing, using copyrighted maps as a reference. --(WT-en) Peter Talk 17:06, 14 September 2007 (EDT)
- For small places a freehand map is definitely ok, but do add a clear "Out of scale" notice to it. (WT-en) Jpatokal 23:08, 14 September 2007 (EDT)
PD symbols for maps
I am just about to start making a couple of new maps, but noticed that the public domain map template contains symbols that do not look so good, especially when scaled to a small size. I think that (WT-en) NJR_ZA has done great things with the template, but there's still some room for improvement. Especially the eat, buy and sleep icons become just quite unrecognizable when scaled down. I still think that the old non-PD ones, ie. simple icons that had room for a number inside, were better. I'd think that it would be very easy to create something similar or find some suitable PD clipart. What do you think? Most of the maps seem to use the cc-by-sa icons without actually crediting the authors (Mark and Paul. mostly).
Also the ATM logo is rather unrecognizable (not many know the ¤ symbol). Also, would a simple @-character be better for internet cafe? -- (WT-en) Trsqr 12:41, 27 September 2007 (EDT)
- If you come up with some or find some I'd love to see them, as an alternative... but I think what we have works fine until we have something else to compare it too... but I agree about the @ sign... I'll probably start using that in the future – (WT-en) cacahuate talk 14:27, 23 October 2007 (EDT)
- I would argue that the sleep icons actually do work well at small scales, but while the current eat and buy icons suffice, they are a bit clunky and difficult (albeit certainly possible) to distinguish from each other in black & white at small scales. I would definitely like to see alternate icon suggestions as well. Most existing maps do use the cc-by-sa icons without attribution, and I think the chances of legal action being pursued over this are about 0%, but this still is a legal violation. --(WT-en) Peter Talk 17:26, 23 October 2007 (EDT)
- Maybe we can create a PD section on Project:Common map symbols and start organizing some usable PD symbols there? --(WT-en) NJR_ZA 17:46, 23 October 2007 (EDT)
OpenStreetMap
So I was poking around on OpenStreetMap today, and I'm really impressed with what they've done. Look at this! Not only do they have offline GUIs for whipping your GPS tracks into maps, but they've even got a pretty usable online tool for drawing and annotating maps on the fly!!
So instead of reinventing the wheel constantly, I'd really like to see Wikivoyage work to integrate better with OSM. This is going to require a serious change of mindset though: instead of fiddling about with hand-drawn SVGs, we'd need to figure out ways to layer WT data onto OSM maps and get that onto our site. As an experiment, I'll try building up a Jakarta map in the next month or so and then exporting the data as image tiles for starters. Dynamically loading OSM content onto WT would be even neater though. (WT-en) Jpatokal 10:35, 23 October 2007 (EDT)
- FYI, OSM starts importing US-gov maps. -- (WT-en) Tatata7 23:12, 11 November 2007 (EST)
- I think integrating OpenStreetMap Maps is an excellent idea, but our bigest stumbling block will probably be the fact that they use Attribution-Share Alike 2.0 rather than version 1.0. They are doing some excellent work over there and I am actually busy setting up my laptop and bluetooth gps to start contributing to the project. Adding WT data to OSM maps is not a huge technical problem; it's all just xml and some simple xslt transformation can easily merge our templates into it. If we can somehow resolve the license issue, I'd be happy to spend some time on the translator. --(WT-en) NJR_ZA 00:03, 12 November 2007 (EST)
I've been playing around with exporting the Helsinki map, but this stuff isn't quite as easy as it seems.
- SVG exports are huge, even a smallish city like Helsinki is >5 MB and renders agonizingly slowly in Inkscape.
- SVG exports have major problems with cropping: coastline rendering is dodgy and eg. exporting Helsinki also brings along a few 70-km ferry routes to Tallinn and long-distance expressways that just happen to start in Helsinki.
- The SVGs aren't really designed to be human-editable, there's all sorts of weirdness like cloned copies of objects on top of each other and the white borders around texts being applied as separate objects. Fine if you want to export immediately to PNG, not so fine if you want to change anything.
An intermediate solution might be to just do a static export of the map to high-res flat PNG, and then apply Wikivoyage annotations on top as a separate layer...? (WT-en) Jpatokal 00:17, 12 November 2007 (EST)
- If nothing else, that would be a great source for traces, but it wouldn't allow us any control over color schemes. --(WT-en) Peter Talk 21:43, 12 November 2007 (EST)
- The Tigre/Line data from the US gov at comes in layers to make it a bit easier to do this kind of work. I haven't played with OSM data yet, but I imagine that we can probably move OSM policy toward layering or whatever else is required to automate our map generation.
- I do recall however that I wound up buying more RAM so that I could finish the Santa-Fe maps. That's also the reason that each Arrondissement of paris is on its own layer.
- Anyhow, I'm in favor of OSM integration, but it's going to be a lot of work up front, and I don't have time to take on another project right now, as much as I'd like to. -- (WT-en) Mark 08:43, 13 November 2007 (EST)

Enough talk, time for action. Here's the first OSM-based Wikivoyage map and I no longer have any doubt that this is the wave of the future.
How I did that:
- Downloaded raw OSM data for the Helsinki region with Tiles@home.
- Used Osmarender with a Wikivoyage-customized XSLT template to generate a (ginormous) "map" SVG. The template is really flexible: you can choose what types of objects you want to render, what colors to use, line thicknesses, fonts, etc etc. Currently I'm using the standard "z16" (zoom level 16) template with only minor tweaks, mostly just removing road coloring and increasing contrast for parks and water.
- Exported a section of the "map" SVG into a flat PNG file.
- Imported the PNG as a layer of a new "Wikivoyage" SVG.
- Added annotations.
Steps 1 through 3 can be automated, but will usually only need to be performed once (a complete city map isn't going to change too often). Ideally, even step 5 could be automated, since OSM data also includes objects like restaurants and hotels, but you'd need to add little Wikivoyage toggles to the OSM data (wikivoyage.draw_me=yes/no) and the annotation box and numbering would still have to be added somehow.
Any feedback welcome. I'll publish the step-by-step instruction and WT template once they're a little more polished, and may even set up a server to allow remote generation of the map SVGs (setting up the OSM software is kinda hairy). (WT-en) Jpatokal 08:47, 10 January 2008 (EST)
- Wow, great job! I'm looking forward to instruction and WT template. And remote generation server is very much helpful, since my map was garbage when I tried Osmarender a month ago... ;-) -- (WT-en) Tatata7 01:54, 11 January 2008 (EST)
Areca map generator
The first public beta version of the "Areca" OSM map generator is now no longer available:
Try eg. "Tampere", "Los Angeles" or "Warsaw" in Find city to see the interface and what maps look like. Please ask here if anything is confusing or broken!
There's still one annoying bug that I'm trying to track down: as map generation takes a long time, connections to the server tend to time out before completion, even though I've tried to fiddle the Apache/PHP settings to stop this from happening. However, the generation still continues in the background, so just check back later and it'll be there.
Up next, the automatic insertion of Wikivoyage data into the maps... (WT-en) Jpatokal 08:19, 6 February 2008 (EST)
- Is it possible to render non-Latin script such as Japanese and Chinese? If so, I think it is helpful if I can select an language extension of the name tag, e.g. name:ja and name:zh, or combine name:zh (name:en) to render 銅鑼灣 (Causeway Bay) . -- (WT-en) Tatata7 05:51, 8 February 2008 (EST)
- Good idea! Let me try to figure out how that works. (WT-en) Jpatokal 05:56, 8 February 2008 (EST)
So, I've completely dumped Areca now, the new game in town is wtp-maps over at Project:How to create a map. I may build a new Web interface for it someday though... (WT-en) Jpatokal 11:07, 9 June 2008 (EDT)
Mapping feature (new)
That is a really great addittion to Wikivoyage!!! (WT-en) 2old 16:39, 27 July 2007 (EDT)
- Project:How to draw a map... ? 71.204.153.163 19:46, 3 August 2007 (EDT)
- Nope, check this out. --(WT-en) Peter Talk 20:08, 3 August 2007 (EDT)
OSM and the move to full automation

User:(WT-en) Mark has being doing some incredible stuff with OSM lately -- take a look at this, which is generated entirely with OSM and WT listing data, including the listing box! (WT-en) Jpatokal 04:48, 26 March 2008 (EDT)
- I've finally written up a little tutorial on how to do this stuff yourself at Project:How to create a map. Take a look -- comments welcome! (WT-en) Jpatokal 11:02, 9 June 2008 (EDT)
- Nice guide, though the UNIX requirement is a bit of a bummer. =) (WT-en) LtPowers 09:39, 13 June 2008 (EDT)
- Is there any way to auto-generate this with Windows? --(WT-en) globe-trotter 16:08, 11 January 2010 (EST)
How to show pedestrainised roads and one-way streets
Hi. I'm in the process of trying to make a map for Sligo, and I'm getting on OK (I think), but I'd like some advice on how to show two specific things
- 1. How do I show a pedestrianised street? The main street in the centre of Sligo (O'Connell Street) was a regular road until about a year ago, but is now pedestrianised. How do I show drivers that this road cannot be used by car now?
- 2. As anyone who has ever tried to navigate Sligo by car will testify, it is a confusing (to say the least!!) mix of one-way streets. How do I show the only direction fo travel on any particular road?
Many thanks. --(WT-en) The.Q(t)(c) 11:18, 27 March 2008 (EDT)
- Good questions. The first is one I've also had, especially for showing which streets and sections of streets have been blocked off in D.C. following 9/11. My hunch is that the best way to handle it would be by adding a pattern to the stroke, (perhaps a criss-crossing X pattern)? I'm not great on coming up with designs, though.
- The second (one way streets) might not be worth doing for really big cities, but I can definitely see how it might help in Sligo. The only thing that comes to mind is to insert arrow-shaped "mid-markers" (from "fill & stroke" --> "stroke style"), and then add nodes by hand to increase the frequency of arrows. But that would be a little bit ugly; hopefully someone else has a better idea. --(WT-en) Peter Talk 11:52, 27 March 2008 (EDT)
Logo inclusion
This project page indicates that the Wikivoyage logo is licensed CC-by-sa 1.0, which would preclude using it in any image that was not licensed identically. Is this accurate? I see lots of maps not licensed CC-by-sa 1.0 that use the logo, and the image description page doesn't list any sort of licensing information. (WT-en) LtPowers 10:58, 16 June 2008 (EDT)
- Yes, we didn't notice this problem until this discussion (which is summed up here).
- Chances are pretty good that User:(WT-en) Mark (and IB, who own the WT trademark) won't sue all the Wikivoyagers (including me) who mistakenly did not a) credit Mark & b) license the "derivative works" as CC-by-SA 1.0. We could go back and fix all the images that have the logos, compass star, or CC-by-SA 1.0 listings icons to include attribution & share-alike as required, but man that would be a big unproductive waste of time. *still hoping Mark might agree to release those icons to the public domain, so that we're not legally required to do that...*
- My "solution" for the time being has been to use the PD map template instead. --(WT-en) Peter Talk 18:23, 16 June 2008 (EDT)
- Well to be honest I don't mind the attribution requirement; I just hate the CC-by-sa 1.0 license. If Mark would multi-license it as CC-by-sa 1.0 and 3.0 I'd be a happy camper. =) (WT-en) LtPowers 18:49, 16 June 2008 (EDT)
- I believe I'm now camping happily, as Mark consented to the relicensing proposal. If I'm not mistaken, the Wikivoyage logo (and the logo-styled compass star) can now be used freely in CC-by-sa 3.0 maps. Does that jive with others' interpretations? (WT-en) LtPowers 15:37, 5 January 2010 (EST)
- Yes, I'd say so. I still want them PD, though ;) --(WT-en) Peter Talk 17:35, 5 January 2010 (EST)
Water pattern

There's a built in pattern called "wavy white"... I laid it over the normal blueback layer, and I think it looks pretty decent... originally I thought it was a bit of a breakthrough in that the last time I tried to use the new water pattern Jani created, I copy-pasted the little square multiple times to fill the background, and this wavy white seemed much easier... I've since realized that there was a pattern created for Jani's square that fills any sized area, but I still think I prefer the way the "wavy white" looks... so I'm proposing using this for water from here out... any objections? Does this print well for WTP needs? – (WT-en) cacahuate talk 04:47, 3 August 2008 (EDT)
- UUUGGGHHHH!!!! Ok, need some help... on a copy of the same svg, trying to repeat the same as above, in the same way, no difference in scale or zoom, even trying to copy and paste the same "white wave", it's showing up much larger, which clearly doesn't work... it's too big and looks fugly. What am I doing wrong? Or more to the point, is it possible to set the scale for patterns? And even if it isn't, why is this changing on me when nothing has changed? Help – (WT-en) cacahuate talk 05:52, 3 August 2008 (EDT)
- I'm going to have to suggest we avoid that pattern entirely. It doesn't seem to translate well into raster images. Look at the PNG you linked of South Asia at full size: there are vertical "lines" (an optical illusion; actually the white wavy lines are too thin in those areas) running through the image. And at smaller resolutions, the pattern looks uneven in spots, just due to the PNG resizing algorithm MediaWiki uses. I recommend sticking with just cyan. (WT-en) LtPowers 10:49, 3 August 2008 (EDT)
- Hmm, I wonder if it's different in various browsers... in mine I can barely see what you're referring to, so faint that I think it's a non-issue, but perhaps we're not seeing it exactly the same. At the moment we've already kinda moved from the plain blue background, per the conversation in above section... Jpatokal added a texture for water and for forest, to help when printed in black and white and for Wikivoyage Press purposes. You can see examples of what he created here, here and here... though it's a small tile that is duplicated as a pattern, and creates much larger blue lines where the tiles merge... I thought maybe "wavy white" would be a good alternative to it – (WT-en) cacahuate talk 16:02, 3 August 2008 (EDT)
- I fear that this pattern might mess with astigmatics ;) --(WT-en) Peter Talk 04:02, 4 August 2008 (EDT)
Map feedback
Hi, folks. I've got [[:wts:Image:Map - Rochester NY Downtown - big icons.png]] up on the Rochester (New York) article, but I'd like some feedback on it, so I can be a little more confident moving on to making other city maps. Is it readable? Too big? Too small? Too busy? Bad colors? What do you think? (WT-en) LtPowers 22:39, 17 August 2008 (EDT)
- Great map, and I tend to never think city maps are too detailed (witness Chicago/South Chicago Shore#Get in. I would strongly encourage you to switch the text for streets and icons to bold and, for the streets, to solid black #000000. That increases readability a good deal. Changing the icon numbers is a royal pain, though, since you need to Ctrl click every single one. I'd also recommend the high contrast colors, particularly for parks and buildings (the colors are on my regions map template svg) since they show up a lot more strongly that way. Otherwise, looks fantastic! --(WT-en) Peter Talk 18:11, 18 August 2008 (EDT)
- I'll see what I can do, though I'm reluctant to set the street names to black. I realize the guidelines on this project page are out of date, but I tend to agree with the statement "This sets the attraction names and plaza names off better." While I don't have any attractions labeled, I do have the neighborhoods, and I think black might draw the eye too much from the icons. I'll give it a try though. (WT-en) LtPowers 19:21, 18 August 2008 (EDT)
- OK, I adjusted the colors and changed the smaller text to DejaVu Sans Condensed. I left the street names dark gray; at black they just stood out too much. I also left them as Blue Highway because I didn't feel like adjusting all of their positions. =) (WT-en) LtPowers 21:08, 18 August 2008 (EDT)
- I'll see what I can do, though I'm reluctant to set the street names to black. I realize the guidelines on this project page are out of date, but I tend to agree with the statement "This sets the attraction names and plaza names off better." While I don't have any attractions labeled, I do have the neighborhoods, and I think black might draw the eye too much from the icons. I'll give it a try though. (WT-en) LtPowers 19:21, 18 August 2008 (EDT)
Railroads
Hey, i've dived headlong into creating a map for Yuzhno-Sakhalinsk - and i'm missing some conventions as to how to mark the railway line - it's a pretty defining feature of the city as it cuts the city into half. And expect this is not the only city where this is the case? (WT-en) Sertmann 17:26, 3 September 2008 (EDT)
- I had a similar problem, so I just made something up. It's a dark reddish-gray line on my map of Rochester (New York). I think it works but I'm open to other ideas. (WT-en) LtPowers 18:40, 3 September 2008 (EDT)
- Check out #Railways. I'd recommend using the solid black line + mid markers format—that's what I've been using on region maps and all the Chicago district maps. And nice work, by the way. --(WT-en) Peter Talk 18:52, 3 September 2008 (EDT)
- Personally, I don't like the mid-markers because the line segments are not all the same length. I also think solid black stands out too much and conflicts with other labels on the map. (WT-en) LtPowers 12:24, 4 September 2008 (EDT)
- Right, i think from the above - it should be quite obvious that a consensus would be nice :-) (WT-en) Sertmann 20:00, 4 September 2008 (EDT)
- The mid markers are definitely not ideal, but in the absence of something like a patterned line, I think they convey "railroad" better than anything else. Another goofy option would be to attach text to the path, and make it a whole bunch of "l"s ;)
- I think the solid black works if and only if the line is thin enough--and you can go very thin with black. --(WT-en) Peter Talk 14:26, 5 September 2008 (EDT)
- I also like the think black with mid-markers, at least as the best option we've found so far, and I definitely think it should have some sort of typical cross marks which are typical of a railroad line, rather than doing a different color on a solid line. It places a marker anywhere you've clicked, so within in reason you can control the spacing with some carefully planned clicking, but I agree this still isn't the perfect solution – (WT-en) cacahuate talk 00:19, 6 September 2008 (EDT)


I'm also not a fan of the "hairy lines" (black lines with the midmarkers), especially on a city map, and it didn't seem like there was a real consensus on this. I've been working with another technique after getting inspired from (WT-en) Stefan (sertmann)'s Copenhagen districts map. I tried it out on Nuremberg city map (though just a first attempt). To me it just seems to stand out a little better (more contrast and easier visibility), plus looks a little neater and more defined. It's simple, I make the solid black line, then make an copy of the line right on top that is white, dashed, and one or two clicks thinner (this gives the thin border). I'd like to hear some thoughts and feedback on this, I know there's plenty of opinions out there. (WT-en) hokiesvt 04:33, 22 March 2009 (EDT)
- Just for comparison, check out these two versions of the Regional Map of Franconia Germany: with hairy rails and with dashed rails. (WT-en) hokiesvt 04:49, 22 March 2009 (EDT)
- For regions maps I'm still undecided. I think the "hairy lines" can work pretty well at the region level, provided they are thin and unobtrusive. Image:Ukraine regions map.png is a good example (although I dislike most everything else about that map). Whereas your city map usage is very compelling. --(WT-en) Peter Talk 15:01, 22 March 2009 (EDT)
- I am not a fan of the cross bars ("hairy lines"); I'd like to see Hokiesvt's idea on a few more maps but my initial impression is positive -- especially, as Peter says, for city maps. (WT-en) LtPowers 16:37, 22 March 2009 (EDT)
- Image:Cph_districts.png, Image:Italy_regions.png, Image:Sakhalin_map.png, Image:Italy_regions.png, Image:Germany_Regions_Routes.png are a few examples on region maps. --(WT-en) Stefan (sertmann) Talk 16:48, 22 March 2009 (EDT)
- Among those, I think it looks best on the Sakhalin map. The thinner the better. On city maps, streets are thicker so railroads can be too. (WT-en) LtPowers 19:20, 22 March 2009 (EDT)
- I like the dashed lines for city maps (particularly for metro/subway) but I prefer the "hairy lines" on region maps as long as they are thinner than the roads (I like how the RR looks a bit lighter on the Ukraine map, too). Not sure if I can pinpoint a reason why, other than I like the look better. --(WT-en) Shaund 22:10, 22 March 2009 (EDT)
- I think we have figured out what the difference is—city and even city district maps allow for thicker lines. The Sakhalin rail line manages to stay unobtrusive by being thin, but at the expense of visibility. I hardly noticed that rail line the first time around.
- On the other hand, getting those mid-strokes properly spaced out is a pain. I tried the dashed version, but used black for both lines, made the dashes further spread out, and the dashed line wider than the solid. For comparison, see the Ukraine examples to the right. Note, though, that this only looks right if the rails displayed are very thin—otherwise the dashes show up as rectangular, instead of appearing to be lines. (And sorry for the thumbnail clutter—I wanted it to display at the resolution shown in the Ukraine article.) --(WT-en) Peter Talk 22:27, 22 March 2009 (EDT)
- Nice. I have to say, they do look a lot better evenly spaced out like that. Good thinking on trying that, too. Are those railroad lines still black? They look very good on the Ukraine map, kinda gray even. That could just be since they are so thin, though. (WT-en) hokiesvt 15:39, 24 March 2009 (EDT)
Automatic drawing a car/bike route by using list of via points
Hello! I would like to make a free overview map of a bicycle race stage (route). Having a detailed list of cities passed, can some software do the work of figuring out the route along the streets (like viamichelin or similar, but with more via points) and draw this route on a map of the region? (WT-en) Nillerdk 13:26, 3 March 2009 (EST)
- Take a look at OpenCycleMap. (WT-en) Jpatokal 00:23, 4 March 2009 (EST)
- I don't understand what you mean. How can a draw a custom route by only supplying a list of via points? The tool should suggest a route following roads between these via points. In the meantime, I have found http://www.umapper.com and http://openrouteservice.org to be able to do more or less what I want. But: umapper is based on a commercial map, so I can't use it for Wikivoyage/Wikipedia-purposes and openrouteservive (OSM-based) is too slow to be of pratical use. What else can you suggest? I would greatly prefer a downloadable program and not some web service. (WT-en) Nillerdk 11:46, 4 March 2009 (EST)
Maps for users without Linux access
Merged from Project:How to create a map:
- Go to Openstreetmap.org and find the area you want to map.
- Hit the Export tab, and select the relevant area, you can draw a box manually, or just adjust the view to fit your requirements.
- Select Mapnik Image, set the format to SVG , and set the Scale to your demands (exported files tend to be quite large), and hit Export to get your SVG file.
- Open the image in Inkscape, now you need to change to colours to fit wikivoyage standards, so hit CTRL+F and insert the colour value of the item you need to change - you can check that by selecting an item with the Edit paths by node tool, hitting SHIFT+CTRL+X and check the rgb value in the style attribute, or just use the table below. Insert the value in the Style box in the CTRL+F (Find) dialog and hit search, and inkscape will now select all items in the svg of that colour, change it to the correct colour (SHIT+CTRL+F), can either be stroke colour or fill colour depending on the item. Repeat the process until you've changed all the colours to wikivoyage style.
| Style attribute | To colour | Type | Notes |
|---|---|---|---|
| rgb(99.607843%,84.313725%,64.705882%) | FFFFFFF | stroke colour | Roads |
| rgb(100%,100%,70.196078%) | FFFFFFF | stroke colour | Roads |
| rgb(92.54902%,59.607843%,60.392157%) | FFFFFF | stroke colour | Roads |
| rgb(66.27451%,85.882353%,66.27451%) | FFFFFF | stroke colour | Motorways, you can also choose red. |
| rgb(80%,60%,60%) | bdb580ff | fill colour) | Buildings |
| rgb(71.372549%,99.215686%,71.372549%) | 89c736ff | fill colour | Parks |
| rgb(54.117647%,82.745098%,68.627451%) | 89c736ff | fill colour | Parks |
| rgb(78.431373%,69.019608%,51.764706%) | 89c736ff | fill colour | Parks |
| rgb(94.901961%,93.72549%,91.372549%) | d0d0d0ff | fill colour | Gray background |
| rgb(70.980392%,81.568627%,81.568627%) | 9ccec9ff | fill colour | Water |
| rgb(20%,80%,60%) | 89c736ff | fill colour | Parks |
| stroke-dasharray | Delete | Path Overlay | |
| stroke-opacity: 0.4 | d0cb75ff | stroke colour) | Paths |

There are probably some items missed on that table, select them with the Edit paths by nodes tool and change to colour either by the same method as above, or just directly will the fill/stoke colour toolbox.
Text Unfortunantly the text in these SVG maps are imported as paths, nothing to do about this, but let's clean it up a bit, hit CTRL+F again and seach for use in the ID box, and delete the items selected - this will remove all the text, but don't worry. hit CTRL+F again and seach for stroke-miterlimit: 10 in the style box. set the stroke colour to no colour, and set fill to black. Now we probably need to increase the text size a bit, so hit CTRL+SHIFT+M, select the Scale tab, and increase the size by 120%-150% (depending dense text is on your map).
The results leave alot to be desired in terms of readability of street names etc, but is largely preferred over the no maps, or openstreetmap.org colour schemes. But please do use the Linux method if at all possible, as it's a much better solution. But now you have a WT style map, go ahead and populate it with listings from the map template, and upload it for all the world to see :). Also note, that while this method seems very complicated and time consuming at first, I'm down to under 5 minutes from import to a WT colour scheme map ready for listings.
Any questions, please feel free to contact me on my talk page --(WT-en) Stefan (sertmann) Talk 12:30, 17 March 2009 (EDT)
- I thought we'd switched to a slightly different color scheme -- particularly a darker green for parks. (WT-en) LtPowers 15:42, 17 March 2009 (EDT)
- OK, I've used the colours from a copy of [[Image:Wikivoyage-map-template-PD.svg]] that I have lying around on my harddrive, has that been updated? --(WT-en) Stefan (sertmann) Talk 16:42, 17 March 2009 (EDT)
- That's awesome, Stefan. Thanks! I knew if I procrastinated long enough on city maps it would eventually get easier. :-) The updated colour scheme is at Project:How to draw a map#Increasing color contrast for better printing. -- (WT-en) Shaund 21:18, 17 March 2009 (EDT)
- Oh yes, I didn't mean to imply dissatisfaction by my minor criticism. =) I can't wait to try this out and see how it works. (WT-en) LtPowers 22:37, 17 March 2009 (EDT)
- Thank you for posting this! After a bit of trial and error, I got a map made using this method. One question though - is there any possible way to trim to filesize of the svg image? Because it is massive, and that's after I tried getting rid of anything unnecessary in the file. (WT-en) PerryPlanet Talk 21:59, 27 March 2009 (EDT)
- Do the paths have a ton of vertices in them? If so, you might want to try (in Inkscape) a Ctrl+L (simplify) operation. Simplifying a path once or twice can often make the path much cleaner without affecting the appearance much. (WT-en) LtPowers 11:22, 28 March 2009 (EDT)
- Thank you for posting this! After a bit of trial and error, I got a map made using this method. One question though - is there any possible way to trim to filesize of the svg image? Because it is massive, and that's after I tried getting rid of anything unnecessary in the file. (WT-en) PerryPlanet Talk 21:59, 27 March 2009 (EDT)
- At work now, but i'll try that out later - though, I don't think that's the problem, maybe merging similar paths can help on the situation. If we are more people trying this out, we may device a much better solution - so please try stuff out. --(WT-en) Stefan (sertmann) Talk 12:09, 28 March 2009 (EDT)
- Lt - That did help a little, but only a little. The filesize probably dropped down maybe .2 or .3 MB, but considering we're talking 4MB files, it's not very much. (WT-en) PerryPlanet Talk 12:26, 28 March 2009 (EDT)
- The trick for working on oversized svgs is to separate content into layers and only work on one at a time--with all other separated layers turned off. Simplifying the road paths (which loses little quality on the OSM exports) also helps. And vacuum defs after any major change, which will keep that file size down. This + deleting extraneous information (which is not always immediately visible) can bring down your file size quickly—my initial 5.5MB file is now around 1.5MB.
- Big thanks to Stefan on this! I was wondering what you were up to. The tips on using the find section are invaluable. Lastly, I recommend thinning out the street paths (using the %size change under stroke style) to clear more space for icons, and to de-clutter maps of larger areas. --(WT-en) Peter Talk 12:40, 29 March 2009 (EDT)
- Wow. Vacuuming the defs really did the trick! My 4.3MB file dropped to a measly 1.7MB! Thanks! (WT-en) PerryPlanet Talk 14:34, 29 March 2009 (EDT)
- Excellent! Can someone do a write up of this, and include instructions on how to deal with the defs? Perhaps then we can proceed to move this out of talk space? It's not that I don't want to do it, but I think my English abilities limits me, in making something this complex, clear to casual mappers and inkscape users. --(WT-en) Stefan (sertmann) Talk 14:40, 29 March 2009 (EDT)
- I'll be happy to—I'll try to do that today. --(WT-en) Peter Talk 14:43, 29 March 2009 (EDT)
- I have now added the how to section. It probably could stand to be edited for clarity, and to reduce the influence of any idiosyncratic practices I am using (I tend to be more anal about maps than most). I also uploaded a very simplified (albeit oddly large in file size) template containing the PD symbols and high contrast colors/patterns, and linked it from the how to guide. --(WT-en) Peter Talk 19:20, 29 March 2009 (EDT)
Does anyone know what font OSM uses as its default? --(WT-en) Peter Talk 20:09, 29 March 2009 (EDT)
- If you want to know about the default osmarender rendering, look here . If you want to know about detault mapnik rendering look here . Of course, there are more OSM renderers than I've had hot dinners. --(WT-en) Inas 21:20, 29 March 2009 (EDT)
- Um, if editing the hex colours of a few xml stylesheets is all it takes, wouldn't it be perfectly feasible to construct a OSM renderer to fit our style, using mapnik and it's SVG capabilities as a template? not that I know anything about this, but juuuust a thought --(WT-en) Stefan (sertmann) Talk 21:56, 29 March 2009 (EDT)
- osmarender is a (reasonbly simple) xslt script to map the OSM XML format to SVG. It then uses inkscape to render the resulting SVG, and build the OSM tiles. To hang osmarender to extract a few features for a svg that are the right colours and fonts would be easy. osmarender generated maps almost always need some tweaking to look like high quality maps, but it could save some work if we wanted to adopt a set of standards. All that really needs to be defined is the bounding box for the extract. --(WT-en) Inas 22:37, 29 March 2009 (EDT)
- Yeah, but aren't we then back to something that requires Linux - where we already have a nearly automated process? --(WT-en) Stefan (sertmann) Talk 22:45, 29 March 2009 (EDT)
- Not at all. I run the entire process on windows no problem. xmlstar runs the xslt process. inkscape command line works fine. just needs memory, lots of cpu cycles, and a stable version of inkscape. --(WT-en) Inas 22:53, 29 March 2009 (EDT)
- Sorry - inkscape commend line is only required to generate the tile. All you need to do generate the svg is xmlstar and the xslt (osmarender), once you have extracted the right bounding box, using osmosis, or similar. --(WT-en) Inas 23:01, 29 March 2009 (EDT)
I have been playing with this and actually getting it to work (sort of) for the first time. I would like to make the point though that OSM's rendering of buildings, even in an obviously very well covered area like central London, is misleading.--(WT-en) Burmesedays 03:04, 9 January 2010 (EST)
- Misleading how? (WT-en) LtPowers 10:45, 9 January 2010 (EST)
- Well there is an implication that if one street has a lot of buildings shown (I think they code them as "signifcant buildings") and the next street doesn't, that this is reality. It isn't in every London OSM map I have looked at. Peter's excellent Soho map is an example. See all those olive brown buildings in the east of the district? This bit is no more built-up than the area showing no specific buildings in the west of the district. --(WT-en) Burmesedays 10:58, 9 January 2010 (EST)
- I don't even get it to work, I tried to use this for a map in Amsterdam, but it doesn't even come close to the map at Copenhagen/Indre By. --(WT-en) globe-trotter 10:49, 9 January 2010 (EST)
- I did say "sort of" :). I am still grappling a bit as well. But after Bloomsbury took me so long to draw by hand, it is at least worth trying OSM svg export for small inner city districts.--(WT-en) Burmesedays 11:03, 9 January 2010 (EST)
- I believe we should only be showing selected buildings anyway. That's what I did on Image:Map - Rochester NY Downtown - big icons.png. I used OSM's buildings (and water) for Image:Map - Walt Disney World - Animal Kingdom.png and it worked fairly well. I can see how it might be a problem for cities, though. =) (WT-en) LtPowers 13:03, 9 January 2010 (EST)
- I'm in full agreement—I'm not really sure what OSM is trying to convey with their different building layers. A shame though, since they make maps look beautiful with zero extra effort on our part. I'll remove them. --(WT-en) Peter Talk 17:36, 9 January 2010 (EST)
High contrast colors & PD symbols
We had these discussions long ago, but we never really updated this namespace article. Should we? Should we retain the old schemes as a second option? One thing I would like to do is remove that link to the old map template that has a thousand unnecessary layers. Thoughts? --(WT-en) Peter Talk 19:27, 29 March 2009 (EDT)
Wikimedia and OSM hooking up
Merged from Project:How to create a map:
The Wikimedia Foundation is working on adding OSM support to MediaWiki, which means that scrollable/zoomable slippy maps can embedded on Wiki pages:
http://techblog.wikimedia.org/2009/04/openstreetmap-maps-will-be-added-to-wikimedia-projects/
This would be great functionality for Wikivoyage as well. (WT-en) Jpatokal 21:58, 4 April 2009 (EDT)
Differentiating highlighted parks

For the National Mall article, I'd like to show clearly the boundaries of the district article via a highlighted area (akin to the light grey we usually use). The problem is that the entirety of the article is also a park, which is denoted via a specific color/pattern, and this does not clearly convey the article's boundaries. I lightened the highlighted portion in this map (compare with this one), but I think it looks a bit ugly, and may ruin the color contrasts we were trying to create. Marc and I were also discussing this issue with regard to Image:Hiroshima Peace Memorial Park.png. Any ideas or suggestions? --(WT-en) Peter Talk 23:32, 23 June 2009 (EDT)
- I'm probably missing something here, but if the article only covers the Mall, shouldn't the map only include icons for attractions within the Mall? If not, then you should be able to use the standard light-gray color to surround those icons outside the Mall proper and have the Mall be included by inference. Another alternative would be to use the light-gray in an area just slightly larger than the Mall, just enough to be seen as a border. (WT-en) LtPowers 09:28, 24 June 2009 (EDT)
- I was feeling lazy and didn't really want to redo things from Washington, D.C.#See, but I've now removed the extra-article icons, which does help define the boundaries. The new version to the right aims to distinguish the article boundaries by removing the tree pattern from the park areas outside of the article's coverage. Still not terribly clear, but I think it's possible to make out what's going on. The main thing I want clear is that the White House & Capitol Building are not covered in the Mall article, although they do need to be marked somehow, since they are major landmarks.
- Also, since the park pattern's color is a little too dark (IMO) to be used as the main foreground region without obscuring street names, I lightened it up just a bit. --(WT-en) Peter Talk 19:19, 24 June 2009 (EDT)
National Park main area color
I tend to think that the currently recommended color for main area in National Park maps is a little too neon. I recommend a softer, darker green:
(74934cff). Here is an example.
--(WT-en) Peter Talk 21:30, 1 July 2009 (EDT)
- Support. I agree and think it would be a major improvement – (WT-en) cacahuate talk 22:49, 1 July 2009 (EDT)
- Neutral. I honestly can't say it makes a big difference to me. =) (WT-en) LtPowers 11:07, 2 July 2009 (EDT)
- Oppose. I don't like the current neon green either, but if we're going to change the main background color, it should be even lighter than that. (WT-en) Jpatokal 11:32, 2 July 2009 (EDT)
OK then, round two:
(5d9415). See the second map for an example.
This "compromise" version seemed to have general appeal, or at least acceptance. I like it, and definitely think it's better than our current neon version. --(WT-en) Peter Talk 02:33, 14 July 2009 (EDT)
North is North
I've noticed a couple maps uploaded lately that aren't oriented for North being "up".... I personally find this confusing, and don't see any benefits, but am I the only one bothered by them? – (WT-en) cacahuate talk 01:51, 14 July 2009 (EDT)
- Examples? There's something to be said for aligning to an existing street grid even if that's moderately skewed (such as Manhattan north, about twenty degrees off of actual north), but I would find a rotation past ~45° needlessly confusing. - (WT-en) Dguillaime 02:12, 14 July 2009 (EDT)
- Examples: Anacostia#Get_in, O'Hare_International_Airport#Get_in, Walt_Disney_World/Hollywood_Studios#Get_around. --(WT-en) Peter Talk 02:26, 14 July 2009 (EDT)
- The purpose of showing compass north, I think, is to help the reader understand the mapped area in relation to its surroundings. This isn't terribly relevant for enclosed areas like an airport, museum, individual resort, etc., since you are cut off from the surroundings. I think the usual convention for mapping such areas is to put the entrance at the bottom of the map. For maps in this category, there's an argument to be made for leaving off the compass altogether. (I like having it there, though.)
- The Anacostia map is rotated just to conserve space—more than half the map would be taken up with non-Anacostia areas if it were not rotated. --(WT-en) Peter Talk 02:38, 14 July 2009 (EDT)
- For most cases, of course north should be up. But a strong case can be made for specific exceptions. Amusement parks would be one. I know O'Hare is almost always depicted south-up. And for long, thin districts or regions (namely Manhattan and Anacostia), a strong argument can be made to orient them efficiently rather than orthogonally. (WT-en) LtPowers 11:35, 14 July 2009 (EDT)
Annotating Maps
I have uploaded a map
from Wikipedia, with correct licensing, of the regions of Graubunden, yet it has no labels and needs some, what is the procedure for doing so. --(WT-en) HJ.Phillips94 08:22, 10 April 2009 (EDT)
- The most useful way to do so would be to use Inkscape to create an SVG map that anyone can easily revise. But ultimately I would recommend whatever program works for you—if MS Paint gets the point across, go for it. --(WT-en) Peter Talk 16:50, 10 April 2009 (EDT)
Roads
The Inkscape road mapping process isn't clear. I tried drawing roads and railroads with the line drawing tools, but they just black out the area and obscure the main map. What do I do? 70.232.86.143 12:23, 29 August 2009 (EDT)
(WT-en) Jonathan 784 12:24, 29 August 2009 (EDT)
- Every shape in Inkscape has a fill color and a line color. You want to remove the fill color and set the line color to black or white or whatever color you need. (WT-en) LtPowers 14:57, 29 August 2009 (EDT)
Uneditable SVG
This SVG map of Tokyo Disney Resort is uneditable, apparently because it has Japanese characters.  (WT-en) Jonathan 784 20:21, 2 September 2009 (EDT)
- I had no problem editing it in my copy of Inkscape a moment ago. Some of the layers are locked — just click the lock next to the layer name to unlock it, and click the eye next to the layer to make it invisible. (WT-en) Gorilla Jones 20:35, 2 September 2009 (EDT)
- Thank you very much. But now I have a problem with the height -- see the next entry. (WT-en) Jonathan 784 22:00, 2 September 2009 (EDT)
Height
My new Tokyo Disney Resort map: http://shared.wikivoyage.org/wiki/Image:TDRmap.png
How do I fix the height problem? (WT-en) Jonathan 784 21:58, 2 September 2009 (EDT)
- Select the rectangle that defines the map's edges, then export "Selection", not the entire image. (WT-en) Jpatokal 23:01, 2 September 2009 (EDT)
- Problem solved. Arigato gozaimazu. (WT-en) Jonathan 784 23:20, 2 September 2009 (EDT)
Missing map templates
swept in from the pub
I tried to download the map templates (svg) [[Image:Wikivoyage-map-template-PD.svg]] but got the message "Data not available". Is it something I am doing wrong? (WT-en) Peter (Southwood) Talk 11:46, 10 November 2009 (EST)
- Don't know but I would not use that one anyway. I spent quite a lot of time a month or so back getting myself up to speed on Wikivoyage maps and I am afraid that a lot of the resource in the Wikivoyage Map Expedition article is out of date (although it is still helpful). I fully intend to get around to updating that article soon. I have to go right now but I suggest you read the correspondence between myself and the ever helpful (WT-en) Peter in my talk page section here (and other useful map making snippets on the same page). There are some current templates linked in that discussion I think. Sorry not be more helpful at this stage but I must go to bed! --(WT-en) Burmesedays 12:04, 10 November 2009 (EST)
- Still can't get any svg to download. I think I am missing an important step. I click on any link that ends in .svg and I get the same message "Data not available". Either there are no svg versions, or I am doing something wrong, but there don't appear to be instructions to do anything else. (WT-en) Peter (Southwood) Talk 14:14, 10 November 2009 (EST)
- I do not have any problems with accessing or downloading those svg files. I suspect it can only be a local problem at your end. Have you tried just copy and pasting the url instead? Eg --(WT-en) Burmesedays 20:34, 10 November 2009 (EST)
- Make sure you are saving the link below the "SVG image," rather than the "thumbnail" itself. I do that all the time... --(WT-en) Peter Talk 23:11, 10 November 2009 (EST)
Updating the article
I would like to set about updating this article and to share the enormous amount of assistance I was given when I first tried to draw a Wikivoyage style map. Before doing so, I wanted to ask if there is any objection to the "two template" option being dropped? I do not see any need for a separate template with a Wikivoyage logo on it. If anyone feels they want to create a map with a logo, it is a very simple matter to copy the logo and paste as an object on their map (remembering to credit the logo). Any objections? --(WT-en) Burmesedays 04:07, 3 January 2010 (EST)
- It should be fine, although do note that the logo is not the only non-PD element in the non-PD template. As long as you're careful to use the free versions of all other graphical elements (such as the North Arrow), I guess it would be fine, although having the logo handy would be nice for those who use it. (WT-en) LtPowers 09:24, 3 January 2010 (EST)
- The non-PD template is actually quite different. The symbols there, including the compass arrow, are all CC-by-SA, not PD, and there are many more symbols than on the standard PD template. It's probably best not mentioned in the article to avoid confusion. --(WT-en) Peter Talk 11:31, 3 January 2010 (EST)
- Can't we just get rid of the CC-by-SA template and just keep the PD template only? Now the "example map" uses the CC-by-SA template. I have also never done the post-processing... is that really necessary? --(WT-en) globe-trotter 08:00, 8 January 2010 (EST)
- Err... I have. Purge cache sir :) And post-processing is totally unnecessary unless you are concerned about server space. Not an issue here. --(WT-en) Burmesedays 08:17, 8 January 2010 (EST)
- Why do I always look at old versions of articles? :P Anyway, seems a lot better! It's important we get this as simple as possible. I learnt how to make maps from the previous version, which worked out nicely, but it was a lot harder to make region articles (as it wasn't covered here, so I had to just look at other's maps and look what they did).
- I think we could get rid of the list of Photoshop, GIMP, etc., as they are not required to make a map. I even think we should focus exclusively on Inkscape, as that's what this guide is built around. Instead of listing all the other programs, I think something like this would suffice: "If you already have another vector-based image program, such as Adobe Illustrator, CoralDRAW, Sodipodi or Freehand, those will work also." --(WT-en) globe-trotter 08:24, 8 January 2010 (EST)
- Good point on other programs. I will deal with that right away. I do think we should mention picture editors as they are helpful for cropping etc. But de-emphasise for sure. On region/country maps, I think the key point is that once a user has acquired the skills to use Inkscape to draw a street map, a region map should be fairly straightforward (with reference to the expedition page). Half the battle is getting your head around Inkscape logic. --(WT-en) Burmesedays 08:30, 8 January 2010 (EST)
- Ah yes, allright. I added the Perry-Castañeda Library Map Collection to the list of possible base images, but now I think it might be better to just include it at the expedition. If only I knew that source when I started making country maps... I also think there should be a new name for "how to create a map", as these names are very confusing. And about the paint editors, I think it's better to list Paint.net , it's free and way easier to use than The GIMP. (WT-en) globe-trotter 08:38, 8 January 2010 (EST)
Nice work, Burmesedays, but I have some questions about some of the changes you made. First, you refer repeatedly to creating layers in the instructions; shouldn't those layers already be in the template? Second, I prefer to see the layer names with at least an initial capital (e.g., "Main area" or "Main Area" instead of "main area"). Third, you've combined the former "Green Spaces" and "Water" layers into "Geography", but I think there's value in keeping them separate. Fourth, the "Annotation" layer has traditionally been for text, with the map icons in "Symbols". Fifth, text layers should be tagged with a language code (e.g., "Street Names (en)") so that SVGs can be easily modified to include other languages. What do you think? (WT-en) LtPowers 09:02, 8 January 2010 (EST)
- Layers could be easily included in the template. I thought about this and wondered if it is not better to familarise users with doing this simple task themselves? The districts template to which Peter pointed me does not currently have any layers.
- Initial capitals, can. Makes no difference at all.
- Why keep green spaces and water separate? Again you could, but I don't nor does the existing region maps template (which does have layers!). I guess I am trying to make this as simple as possible and eliminate unnecessary layers.
- Annotation & symbols. Do they need to be separate though? When I first started drawing maps I kept them separate as per the old instructions; indeed I had a convuluted mass of unnecessary layers, but I am not sure they need to be?
- Text. Dead right, my mistake and will put right immediately. --(WT-en) Burmesedays 09:25, 8 January 2010 (EST)
- In the article it says to place the geography layer under the roads layer -- but a roads layer was never made. I think it makes sense to have a few more layers (like to keep roads and railways separate, and I also feel like water and parks could be separate). And maybe it would be handy to have the layers already defined in the file, this way everyone uses the same system of layers (though it can be a bit confusing at first with all the empty layers). --(WT-en) globe-trotter 09:17, 8 January 2010 (EST)
- Roads layer is called transportation routes, so roads is a naming error. I did this in between 2 power cuts today and it got a bit messy. On layers, my objecive was the fewer the better. Why keep roads and railways separate? Just move the objects up and down within the layer. --(WT-en) Burmesedays 09:25, 8 January 2010 (EST)
- I think having more layers is better, as there are more options. Someone could print a map with railways, metros, etc. or make a map that leaves them out. Also it's easier to make roads go over railways, or to make roads go over railways instead. It's easy to change that by changing the layer order. We could also choose to have less layers (such as using transport, geography), but then we have to explain in the article how to move objects up or down within a layer (which I think makes it harder. I never moved objects up or down when working on my first map). (WT-en) globe-trotter 09:31, 8 January 2010 (EST)
- Maybe. Let's leave this point until we get some more opinions. I am certainly not fixed in the way I would like to see this presented. As long as we successfully update and simplify what was here before, I will be happy. I do maps in my own peculiar way in any case :). I have tried to present this advice in a way that will make sense to those who have no graphic design experience. --(WT-en) Burmesedays 09:44, 8 January 2010 (EST)
- I also think it's better to give some ideas which widths someone could use for roads. Such as that 1,2 mm for small roads and 1,6 mm for big roads). (WT-en) globe-trotter 09:36, 8 January 2010 (EST)
- That I do not agree with and thnk it is confusing to say the least. It depends on the size of your base image. 1.2 mm might be right or it could be way too small or too big. We can only give road dimensions if the scale of the base image and the size of the main area layer are pre-defined. Even then, they might be wrong. --(WT-en) Burmesedays 09:44, 8 January 2010 (EST)
- The mistakes pointed out above plus some other good advice have already been implemented. --(WT-en) Burmesedays 09:46, 8 January 2010 (EST)
Re: by Peter, I'm puzzled a) why he removed the (en) and b) why he removed DejaVu Sans Condensed. DejaVu Sans is a very wide font; Condensed is necessary, IMO, to keep text lengths down to a reasonable level. (And of course I still wish we could find a better font than DejaVu, but free options are limited.) (WT-en) LtPowers 13:34, 8 January 2010 (EST)
- I think the (en) in the streets is removed because it's wrong. The layer should remain street names, but could have a sub-layer with en. --(WT-en) globe-trotter 13:46, 8 January 2010 (EST)
- To explain my changes:
- Yes, translations should be done in sub-layers.
- All district maps I have made use DejaVu Sans (or its identical, but less ideal twin Bitstream Vera Sans) rather than DejaVu Sans condensed for all street names, labels, etc. The only part of the districts template that is using the condensed form is the text for the icons. I don't think it's too hard to get it to work right, and it allows you to use smaller font sizes without sacrificing print readability. It is also at present the required font for Wikivoyage Press, and it's nice to keep our standards here in rough alignment with the Press'.
- All translatable material should be separate from non-translatable material, which includes icons.
- I do prefer to not include the layers in the template because: a) it's good for users to understand how layers work on their own (I sure didn't when I started with the old template); b) importing the template into an SVG file that already has layers will cause problems; c) it's nice to allow users extra flexibility with choices of layers to suit their own idiosyncracies in using Inkscape.
- As GT says, it's useful to separate rails & roads because someone may want to turn one off for an export. I don't think that applies to the different types of geography, where anyone is probably going to want them on. If they don't, it's very easy to select all at once via Ctrl-X -> paste details into Ctrl-F. I actually just combine all parks, etc. into a single path to keep things simple. --(WT-en) Peter Talk 15:39, 8 January 2010 (EST)
- I prefer to include the layers so that they're standardized; it makes it easier for someone to come along later and make any necessary changes. (WT-en) LtPowers 16:07, 8 January 2010 (EST)
- ...not to mention to avoid the need to create all those layers every time one starts a new map. (WT-en) LtPowers 16:12, 8 January 2010 (EST)
- I prefer to include the layers so that they're standardized; it makes it easier for someone to come along later and make any necessary changes. (WT-en) LtPowers 16:07, 8 January 2010 (EST)
- Thanks for the all the changes Peter. I have though removed the second link to How to Create a Map from OSM data as I think this will just confuse folks - this is an article about drawing a map. The How to Create a Map page is already linked at the top. I am off out right now and will have a much closer read later. Completely re-writing this article was a bit of a slog and I am pleased that it has elicited so much response. --(WT-en) Burmesedays 20:17, 8 January 2010 (EST)
- I just wanted to say you guys are doing a great job at hashing these issues out and improving the page. It looks like I'm pretty late to the conversation, but I prefer keeping the roads and rails separate. One, to hide/unhide as discussed above, but I also find it a touch faster to select the entire layer than go through the Ctrl-X process to pick out just the roads or the railroads when I want to edit their properties.
- I hear both sides on the layers issue (I keep two copies of the template - one with the layers for tracing a map and one without the layers when I'm using someone else's SVG file). I'd have a slight preference for keeping the layers in the template for the reasons Lt Powers mentioned. (WT-en) Shaund 02:43, 9 January 2010 (EST)
Inkscape
Has anyone downloaded and used consistently the new 0.47 version please? I am using 0.46 and do not want to update unless I am sure of stability.
- Also, LT Powers, I see you changed my comment about lack of an autosave feature. Where do you turn it on please? It is not in preferences as far as I can see. My Inkscape 0.46 definitely does not autosave by default. Any help gratefully received as this has caused me some angst when the program hangs. Cheers. --(WT-en) Burmesedays 10:33, 8 January 2010 (EST)
- It's in preferences and then 'save'. It's really necessary as the program hangs so often... maybe good to include in the guide even, this has given me plenty of headaches =( --(WT-en) globe-trotter 10:52, 8 January 2010 (EST)
- Hmm. No save option in my Inkscape preferences. You using 0.46 as well? or the new 0.47? There is a note about autosave and in the Inkscape tips section of the article. Please change it to tell folks how to do it... even if I can't:( --(WT-en) Burmesedays 11:13, 8 January 2010 (EST)
- It's new in the 0.47 update. Which I'm glad for as it crashed really a lot in the past. --(WT-en) globe-trotter 13:22, 8 January 2010 (EST)
- I'm using 0.46 but I know when I crash it usually creates a backup file (with a filename ending in ".0"). (WT-en) LtPowers 13:23, 8 January 2010 (EST)
- God, I can't wait for .48—there is still so much more that really needs to be done. Especially better pattern support and the ability to center your window on a selection... --(WT-en) Peter Talk 15:50, 8 January 2010 (EST)
0.47 (which I downloaded yesterday) has an irritating bug we should be aware of. When you change the saturation level of a filled object via the opacity slider, it does not always restore to 100% properly, nor will it allow you to re-fill the object manually. I had a lot of problems with this today producing the Java and Bahrain maps. A work-around is to copy the problem object to another layer, redo the fill there, and then copy it back to where you want it. Irritating to say the least. It is also intermittent with no apparent trigger. --(WT-en) Burmesedays 12:03, 10 January 2010 (EST)
- That happened to me often last year, but has stopped... Perhaps the program ages well? (Looking forward to .48...) --(WT-en) Peter Talk 15:47, 10 January 2010 (EST)
- A bit like me then :) :) --(WT-en) Burmesedays 22:59, 10 January 2010 (EST)
I have today uninstalled Inkscape 0.47 and gone back to using 0.46. Ver 0.47 just has too many bugs. Apart from the peristent restoration of fill problem described above, I am getting a lot of "Fatal Error - Too Many Heap Sections". Happens on both Windows XP pro and Windows 7 platforms. In my experience, 0.46 is considerably more stable than 0.47. --(WT-en) Burmesedays 03:20, 26 January 2010 (EST)
- I get those errors all the time. I got very used to just saving at least every 1 minute, I now do it even without noticing. "Did I just save?" --(WT-en) globe-trotter 01:44, 8 February 2010 (EST)
Complete amateur
"A map of the West End of Washington, D.C. — created by a complete amateur using the instructions below". User:(WT-en) Peterfitzgerald? :P --(WT-en) globe-trotter 13:25, 8 January 2010 (EST)
- Ha, do I count as a pro? --(WT-en) Peter Talk 15:29, 8 January 2010 (EST)
- Wikivoyage Chicago? =) (WT-en) LtPowers 16:04, 8 January 2010 (EST)
- That's why I chose one of my maps for that example (which was then removed). I am certainly a rank amateur. --(WT-en) Burmesedays 20:11, 8 January 2010 (EST)
- I removed it for two reasons alone, both regarding how closely it follows our desired format: 1) it would be best to show a trace of streets outside the district itself, and 2) roads should all be white. I'm all for experimentation, but I think it's important to be strict about the map image shown in this article. --(WT-en) Peter Talk 20:57, 8 January 2010 (EST)
- If we want folks to draw a street grid outside the district they are mapping, then let's tell them to do it in the instructions. Personally I think main routes in is enough, as I did with Bloomsbury. On colour, I kind of like the way the roads outside the district are a different colour as it differentiates nicely. But no worries and I have changed the Hampstead map as it was also wrong according to those criteria. Also, if we want to be totally precise, I think all maps shown as examples should use inset boxes as per the instructions and not a plain text title. --(WT-en) Burmesedays 21:11, 8 January 2010 (EST)
Possible to adjust scale of patterns?

I just recently switched over to Ubuntu from Windows, and lo and behold, Inkscape suddenly has a tool to scale patterns!!! Whether I somehow just did not notice this in Windows, or whether it is Linux specific, I don't know. In the screenshot to the right, the pattern scale adjust tool is the square/circle/x to the left of the patterned object, and it appears automatically when selecting a patterned object with the node editor (F2). I can't stress how much easier this will make my mapmaking life. --(WT-en) Peter Talk 12:34, 9 January 2010 (EST)
- I've seen that and I'm using Windows. I had some problems getting it to work right, though. (WT-en) LtPowers 13:11, 9 January 2010 (EST)
- To think, all this time it was there... It only works with objects, not paths, so make sure not to convert objects to paths unless you're ready to give up control of the pattern's scale! It's frustrating that you can't convert paths to objects... --(WT-en) Peter Talk 15:27, 9 January 2010 (EST)
- I'm using Windows and I don't see it. --(WT-en) globe-trotter 16:01, 11 January 2010 (EST)
- The box may be some distance away from the object. On another note, I just tested it out on a path and it seems to work. (WT-en) LtPowers 16:27, 11 January 2010 (EST)
- Inkscape should get 10/10 for the effort made to disguise the existence of this very helpful tool. Annoyingly, for many of the patterns on my old maps (i.e. the ones I want to "retrofit"), the tool comes up with the square and circle only, and no x. Any idea why that might be?--(WT-en) Burmesedays 20:57, 7 February 2010 (EST)
Exporting from openstreetmap
swept from pub:
I am trying to export an svg-file from openstreetmap but without much luck (after pushing 'Export' and choosing 'Mapnik Image', I do not get the list of file formats to choose from). Does anyone else have the same problem? and is there a way around it?, --(WT-en) ClausHansen 01:08, 4 March 2010 (EST)
- It seems to be broken for me right now as well. I suggest trying again later.--(WT-en) Burmesedays 01:14, 4 March 2010 (EST)
- It's working for me. The options section is simply not showing up? I know that you cannot export SVG images if you are not zoomed in close enough, but this sounds like a different problem that I haven't seen before. --(WT-en) Peter Talk 01:28, 4 March 2010 (EST)
- Could be a different server I guess? When selecting Mapnik as normal, there is no output format option. --(WT-en) Burmesedays 04:00, 4 March 2010 (EST)
- I think this is a browser issue. Working fine in Chrome and Firefox but not in IE.--(WT-en) Burmesedays 04:07, 5 March 2010 (EST)
- Thats right, thanks a lot!, --(WT-en) ClausHansen 05:08, 5 March 2010 (EST)
Template for districts
The template we advise everyone to use has the wrong font in use for numbers on the icons. It is current DejaVu Sans (bold) and should be DejaVu Sans condensed (bold) I think. The latter produces numbers which are more legible when printed. From all recent discussions I have seen, condensed is the font advised for icon numbers, so I will change and upload the corrected template.--(WT-en) Burmesedays 06:11, 21 March 2010 (EDT)
- In fact, single digits were DejaVu Sans and double digit numbers condensed. I have changed all to be condensed. --(WT-en) Burmesedays 06:15, 21 March 2010 (EDT)
Ordnance Survey Open Data
swept in from pub:
The Ordnance Survey is the Government Agency responsible for mapping in the UK. They have recently released all their map data for use by anyone who wants it. Could this be used for Wikivoyage Maps? It's certainly a lot more detailed than OSM especially away from the main cities, probably more reliable too. The full license can be viewed at . It specifically states that the data can be copied, distributed, transmitted, adapted, exploited commercially, sublicensed, combined with other data and included in products and applications. Surely this means it can be used in Wikivoyage? Or is it not as simple as that? (WT-en) Tarr3n 09:30, 6 April 2010 (EDT)
- I am delighted that the producer of the most startlingly brilliant maps in the world has taken this progressive move. I am sure that the licence is OK for Wikivoyage copyleft, provided that the attribution instructions are followed to the letter. That's the really good news.
- I have only had a quick look but I am less sure about how useful it will be for us due to the format the data is provided in. There are many differnt map options, but I just tried to order a download of one UK grid square and it only offers you TIFF format. For this one square, the download size is huge - nearly 2 gigs, so I will not do it on this computer where I pay for monthly excess :). Early days and some playing is required. If we can get this to work it will be an amazing resource. --(WT-en) Burmesedays 10:18, 6 April 2010 (EDT)
- Yep, the following statement makes it clear beyond a shadow of a doubt that we can use it:
- These terms have been aligned to be interoperable with any Creative Commons Attribution 3.0 Licence. This means that you may mix the information with Creative Commons licensed content to create a derivative work that can be distributed under any Creative Commons Attribution 3.0 Licence. --(WT-en) Peter Talk 10:39, 6 April 2010 (EDT)
- Thanks for pointing this out. I ordered the download of one central Scotland street view square (NS). I got the download link about an hour later. This gave me a 655Mb Zip file, which contained 21543 files. About 20000 of these are text files (.tab &.tfw), georeferencing the whole of the UK. The actual map data is in nearly 400 TIFF files. Each TIFF file is a map of a 5km * 5km tile. The map is a detailed 1:10k street map, which shows individual houses in a street. At the moment this looks like far too detailed information to be of use to a traveller, it is more practical to use the OS viewer or one of the other online street maps. However this is a great resource and I am sure that some good uses will follow. There are other maps available such as 1:250k which may be more useful. (WT-en) AlasdairW 18:25, 11 April 2010 (EDT)
Drawing a Transit Map
How do you draw a transit map similar to the schematic subway maps you see all over the place? I think a couple of cities near me with complex public transport systems would really benefit from their inclusion; but I don't know where to even start. Is there some software that can do it, or at the very least, help through the process please? 81.141.73.29 19:26, 29 June 2010 (EDT)
- It can be done with Inkscape, and the process is not much different than creating a street map. --(WT-en) globe-trotter 19:54, 29 June 2010 (EDT)
- Well, except that transit lines aren't shown on public-domain satellite views, so there's no easy way to trace them unless they follow streets. (WT-en) LtPowers 21:33, 29 June 2010 (EDT)
- As a tip, OpenStreetMap.org generally does show public transport networks. --(WT-en) globe-trotter 13:16, 30 June 2010 (EDT)
Anyone have this Inkscape problem?
Swept in from the pub:
Putting this here to attract more attention. I use Inkscape to operate on maps, as most of us do, but I have an issue that I haven't been able to find a fix for elsewhere online. When I use the fill function, it's very slow and after filling 2 or 3 areas, it crashes entirely. I'm using Windows 7, and I updated to the most current version of Inkscape but the problem persists. Does anyone know of a fix for this? Or does anyone have a suggestion for another free, open-source vector graphics program? I'm trying to go on a map-making spree for Brazilian regions, and this is frustrating me greatly. (WT-en) Texugo 10:48, 3 February 2011 (EST)
- I know I am. Either it's my computer, the new version of Inkscape, or the map files we're using these days are just too much for my computer. I just can't make maps at the pace I used to. (WT-en) PerryPlanet Talk 14:02, 4 February 2011 (EST)
- I am using Inkscape 0.47 on XT and dont seem to have anything like your problem. Maybe I misunderstand, so could you explain in more detail what is happening with an example I can download and do comparative test. I have tested a map of about 3.8MB with about 50 layers at a guess. Selected all objects in a layer with 10 objects, blanked the fill and replaced it with something different. process time order of a second - you could see it happening, but only just. • • • (WT-en) Peter (Southwood) Talk 06:50, 6 February 2011 (EST)
- The best answer is of course to use a fully developed vector drawing program like Illustrator :). More seriously, the object fill function has had problems in every version of Inkscape I have used. Some of the map files I have drawn are relatively huge (especially so when using imported PDF plot points), and the fill function routinely hangs after changing the opacity slider (for example). I understand your frustration Texugo. --(WT-en) Burmesedays 22:30, 24 May 2011 (EDT)
- After making about 6 Brazil state maps, I put the project on hold out of frustration with Inkscape. I may look in to getting Illustrator or something, because there are still dozens of maps I'd like to make...(WT-en) texugo 22:43, 24 May 2011 (EDT)
- I've never had a problem. What version of Inkscape are you using? (WT-en) LtPowers 13:36, 25 May 2011 (EDT)
- Long-standing problems with the Inkscape fill function were also discussed here.--(WT-en) Burmesedays 20:19, 25 May 2011 (EDT)
- I've never had a problem. What version of Inkscape are you using? (WT-en) LtPowers 13:36, 25 May 2011 (EDT)
- After making about 6 Brazil state maps, I put the project on hold out of frustration with Inkscape. I may look in to getting Illustrator or something, because there are still dozens of maps I'd like to make...(WT-en) texugo 22:43, 24 May 2011 (EDT)
- The best answer is of course to use a fully developed vector drawing program like Illustrator :). More seriously, the object fill function has had problems in every version of Inkscape I have used. Some of the map files I have drawn are relatively huge (especially so when using imported PDF plot points), and the fill function routinely hangs after changing the opacity slider (for example). I understand your frustration Texugo. --(WT-en) Burmesedays 22:30, 24 May 2011 (EDT)
- I am using Inkscape 0.47 on XT and dont seem to have anything like your problem. Maybe I misunderstand, so could you explain in more detail what is happening with an example I can download and do comparative test. I have tested a map of about 3.8MB with about 50 layers at a guess. Selected all objects in a layer with 10 objects, blanked the fill and replaced it with something different. process time order of a second - you could see it happening, but only just. • • • (WT-en) Peter (Southwood) Talk 06:50, 6 February 2011 (EST)
Foreign alphabets and street names
 |
 |
If street names are displayed in a foreign alphabet, should we transliterate them for our maps? My gut says no, since a traveler will need to be able to identify what is written, but it seems that other travel guides do transliterate them to the Latin alphabet. Am I crazy? --(WT-en) Peter Talk 20:26, 14 June 2011 (EDT)
- I would suggest leaving it up to the map maker. For example, I might want to make a map for a Chinese town. I would though be completely incapable of labeling streets (or anything else) in anything other than transliterated English. I would say it is better to have a usable map than no map at all as we introduce rules that many (most?) map-makers be neither comfortable with nor capable of implementing. Looking at Google Maps, often they seem to label in both English and the local language. For those capable or willing to do so, that might be the way to go. --(WT-en) Burmesedays 21:05, 14 June 2011 (EDT)
- I guess that would be ideal, but would take up too much space for our purposes. I bring this up as I'm finishing up a map for a Russian town, and wasn't sure whether Cyrillic street names would be better. --(WT-en) Peter Talk 21:21, 14 June 2011 (EDT)
- I have now put the two versions of said map at the top to illustrate. It may be hard for me to be objective, since I understand Russian, but it seems to me that having the untransliterated street names would be more useful, especially since Cyrillic isn't that hard for English speakers to decipher. But that goes against all other standards I can find. --(WT-en) Peter Talk 02:00, 15 June 2011 (EDT)
- It's a tricky one Peter and I can see arguments both ways. For this particular map, I think you could fit most, if not all, street labels in both languages without destroying the utility of the map. Perhaps try Cyrillic with English in brackets? Lovely looking map by the way. --(WT-en) Burmesedays 02:22, 15 June 2011 (EDT)
How do we display addresses within the travel guides? Ideally, maps should match the listings, I would think. On the other hand, I'm not sure how useful the transliteration is; does it help in pronunciation? (WT-en) LtPowers 09:02, 15 June 2011 (EDT)
- Ha, that's another question. It's the same problem really—I only see other guides using transliterated addresses, and that's what most all of our contributors have been doing here as well, but I did use Cyrillic for the addresses
- And yes, the one real value with transliteration would be that it takes less work for an English speaker to figure out the pronunciation.
- I guess the other value would be that foreign scripts can look intimidating and hard to recognize if unfamiliar—even though, say, Georgian is a really simple alphabet, the sheer exoticness of its appearance would probably stress out a traveler. That's why I ask whether Cyrillic might be an exception, since it's not so foreign (but I could be biased).
- I probably could squeeze in a bunch of extra names to this map, but I'm more looking for a categorical answer, that I could apply to other articles as well. --(WT-en) Peter Talk 10:40, 15 June 2011 (EDT)
- I see you changed the park names to be in English, which I was going to mention earlier but forgot. That's a good change. As for the street names, I have to admit I don't find Cyrillic particularly recognizable. Yes, the letterforms are derived from the same Greek alphabet from which the Latin alphabet was derived, but they're two distant cousins at best. I wouldn't treat Cyrillic any differently than katakana or Arabic. (WT-en) LtPowers 14:10, 15 June 2011 (EDT)
- I'd say having the transliteration is absolutely necessary. Not knowing cyrillic, I usually can't work out the pronunciation, and having a map where I can't work out the pronunciation is very annoying. Not really any better than having a map written in Khmer or Inuktituk.(WT-en) texugo 23:43, 15 June 2011 (EDT)
- I see you changed the park names to be in English, which I was going to mention earlier but forgot. That's a good change. As for the street names, I have to admit I don't find Cyrillic particularly recognizable. Yes, the letterforms are derived from the same Greek alphabet from which the Latin alphabet was derived, but they're two distant cousins at best. I wouldn't treat Cyrillic any differently than katakana or Arabic. (WT-en) LtPowers 14:10, 15 June 2011 (EDT)
Inkscape woes round X
I've painstakingly made a really nice map of Moscow Oblast, but I haven't been able to export a PNG due to Inkscape crashing. Perhaps I could send it to a volunteer to give it a whirl? It's over 24MB, so I cannot upload it here, and said volunteer would have to have a pretty fast computer to work on. --(WT-en) Peter Talk 14:13, 22 June 2011 (EDT)
- Well, never mind. I managed to piece together a PNG by taking screenshots. Not ideal, but it works. By the way, OSM is getting awesome. --(WT-en) Peter Talk 15:48, 22 June 2011 (EDT)
- What's the nature of the issue Peter? Is it the size of the SVG? If so, what have you used as base material to make the SVG so large?--(WT-en) Burmesedays 20:52, 22 June 2011 (EDT)
- The size is the only thing I can imagine, but I'm not sure why that would hang it up. I used pretty fine grained OSM data over a very large territory—loads of nodes! What's frustrating is that my PC now could handle it right up to the point of exporting... --(WT-en) Peter Talk 21:12, 22 June 2011 (EDT)
- If you just need raw processing power I might be able to help - I just got a new machine that's fairly fast. If you can email me instructions on what I need to do (you already have my address I think) then I can set up an FTP upload and give it a go. -- (WT-en) Ryan • (talk) • 21:22, 22 June 2011 (EDT)
- Instinctively, I suspect the issue is RAM. Certainly when loading a very fine-grained PDF in Inkscape, the demands on RAM are extreme. It may well be the same with OSM XML or Mapnik data.--(WT-en) Burmesedays 23:02, 22 June 2011 (EDT)
- Inkscape 0.48.1 crashes when opening the file for me with a Visual C++ runtime error (see http://www.inkscapeforum.com/viewtopic.php?f=29&t=6344 and https://answers.launchpad.net/inkscape/+question/129974, which look like the same issue). I've got a new-ish i7 processor with 8GB of RAM, so this may be an Inkscape issue rather than a RAM or processor issue. -- (WT-en) Ryan • (talk) • 23:39, 22 June 2011 (EDT)
- I would advise reducing the number of nodes. The number used in the typical OSM export is generally excessive. Simplifying the curve (ctrl+L) can often reduce the number of nodes significantly without affecting the appearance to the naked eye. (WT-en) LtPowers 14:22, 23 June 2011 (EDT)
- Already done—the raw export was something like 38MB. --(WT-en) Peter Talk 22:44, 23 June 2011 (EDT)
- Hmm. My next suggestion would be to change some of the green areas to larger blocks of solid color, rather than the carefully interspersed small regions of green. The current map shows much more green-area detail than we usually use in maps of this scale. (WT-en) LtPowers 09:27, 24 June 2011 (EDT)
Merge
Merged from Project:How to create a map:
I'd like to archive the basically defunct "expert map" process, and merge this article into Project:How to draw a map. I think the organization across the two articles would be confusing to anyone getting started trying to make maps. I also have some ideas of how to simplify and better present the existing content after a merge. Would anyone mind if I give this a go? --(WT-en) Peter Talk 17:35, 13 October 2011 (EDT)
- Go ahead and give it a shot, but I'd hate to lose the instructions here. I remain a bigger fan of tracing maps over importing them from OSM, just due to the tedium of making sure all of the path properties are correct and simplified enough. (WT-en) LtPowers 08:46, 14 October 2011 (EDT)
- Oh, I fully intend to keep both. --(WT-en) Peter Talk 19:54, 14 October 2011 (EDT)
Expert maps process is now archived here: Project:How to create a map/Expert maps. --(WT-en) Peter Talk 11:17, 14 May 2012 (EDT)
OSM
I've SVGs maps imported from OpenStreetMap to be overly detailed (too many nodes) and often inaccurate. Tracing a satellite image is more time-consuming initially but I've found it more flexible and easier to excise unimportant information -- or to customize the appearance of unusual features (like the overpasses/underpasses in my Niagara Falls (New York) maps). Are we sure we should be emphasizing OSM imports so strongly? (WT-en) LtPowers 10:11, 19 August 2011 (EDT)
- In theory I would agree with you and I have in the past used bog-standard tracing even for some very detailed maps. However, there is no doubt that OSM SVG or PDF exports save a huge amount of time once you get used to manipulating the data you actually need. Even for a country map, taking the paths for the basic outline from OSM saves a large amount of tracing time.--(WT-en) Burmesedays 10:51, 19 August 2011 (EDT)
- Maybe I just need to refine my technique. =) (WT-en) LtPowers 13:37, 19 August 2011 (EDT)
Newbie alert
Merged from Project:How to create a map:
After many years of ignoring Inkscape I decided to give this a shot, but having almost no experience with drawing programs I'm fairly lost. A few questions:
- Is Project:How to create a map#SVG imports from OSM still the right way to start? It looks like Open Street Maps may have changed slightly since this article was written (for example, the export option is no longer "Mapnik Image"). I'm using Inkscape 0.48.2, which may also be different from what's outlined in this article.
- The first instruction is "The first and simplest thing you can do to reduce that filesize and make the SVG more manageable is to delete the light gray background object, which for some reason tends to include thousands of extraneous nodes." Maybe I'm utterly dense, but no matter what I try I'm not able to grab the background image. I've tried selecting all and ungrouping, alt+click, etc, but any attempt to delete removes the entire OSM import. Any idea what I'm missing?
- Similar to #2, is there an easy way to select items by color? I've tried the "pick colors" tool, but it always gives me #000000 and any selection ends up selecting the entire document.
Please don't bite the newbie, but any help would be appreciated. I looked at the Inkscape tutorials in the "Help" menu and Googled a bit, but thus far haven't found the answers to the above basic questions. -- (WT-en) Ryan • (talk) • 01:03, 11 May 2012 (EDT)
- It looks like you fixed #1 a few days ago.
- For #2, you'll have to ungroup twice. Unfortunately, this removes the cropping (the exported SVG has all of its contents cropped to the specified size)... but that will reveal the true extent of this problem. Any path that goes through your map rendering area exists in full in the SVG -- and even some paths that don't go through your map rendering area. (You just can't see them beyond the crop borders.) For example, I exported a map of a village about 10 miles south of Lake Ontario. The entirety of Lake Ontario (69,469 nodes) was exported, even though none of it actually appears in my specific map borders. It appears that since part of Lake Ontario extends south of my map borders (even though it's not the part within my east/west borders), it exported the whole dang thing. So it's not just the gray background you'll want to delete (after ungrouping twice), but any other extraneous stuff you see when zoomed wayyyy out.
- For #3, go to Edit > Find, and fill in the "Style" field (check or uncheck the options as needed). The Style field takes a value of the form "attribute:value", as they appear in the XML that underlies the SVG. For example, searching for a Style of "fill:#b3cfcf" will find lakes and oceans. (Use "stroke:" for line colors, and make sure you include only the first six [RGB] hex digits; the seventh and eighth designate opacity and are not stored as part of the color attribute, so the Find won't find them that way.)
- -- (WT-en) LtPowers 11:49, 11 May 2012 (EDT)
- Thanks, will give this a shot over the weekend - it's a fairly humbling experience to be unable to figure out how to do something as simple as selecting a background, so the assistance is much appreciated. -- (WT-en) Ryan • (talk) • 13:18, 11 May 2012 (EDT)
- As another tip, CTRL+click should allow to select an item that is inside a group. (WT-en) LtPowers 18:50, 11 May 2012 (EDT)
- Thanks, will give this a shot over the weekend - it's a fairly humbling experience to be unable to figure out how to do something as simple as selecting a background, so the assistance is much appreciated. -- (WT-en) Ryan • (talk) • 13:18, 11 May 2012 (EDT)
- Much thanks for the help. A first draft of the weekend's efforts is at [[:wts:Image:Yellowstone-map.svg]] / [[:wts:Image:Yellowstone-map.png]]. Another thing that confused me for a bit was that there seemed to be no way to move the OSM import to its own layer - eventually just copying it, deleting it, and then pasting into a new layer seemed to be a viable workaround, but perhaps there's a better way? -- (WT-en) Ryan • (talk) • 23:47, 12 May 2012 (EDT)
- I had the same problems that you listed. Question; how do you crop the SVG? Using LTPowers' example, how would you simply show the small portion of Lake Ontario, deleting the outside bits that you don't want? I seem to have a lot of roads sticking out the edges of my map, and can't find a 'crop' function. (WT-en) JamesA >talk 03:01, 13 May 2012 (EDT)
- From a Google search I don't think crop is available - since an SVG deals with shapes it's apparently not easy to automatically remove portions of the shapes. I don't know what others might have tried, but the OSM export I used included a larger area than I wanted in the final map, and I just created a rectangle to select the portion I wanted in Inkscape and then exported that selection to PNG. -- (WT-en) Ryan • (talk) • 03:10, 13 May 2012 (EDT)
- That's unfortunate, but I didn't realise you could simply select one area to export as a PNG. Thanks for the tip; I'll try it out. I also recommend the creating a map guide is modified accordingly from the discussion that's been had. (WT-en) JamesA >talk 08:14, 13 May 2012 (EDT)
- I don't know of a way to crop the entire SVG, but you can crop individual objects. It's handy for dealing with the Lake Ontario situation above. There's a tool for editing nodes -- in the version of Inkscape I use (.46 or .47), it's the second button from the top on the left-hand tool bar. Select that tool and then select the object you want to crop. All the nodes in the object should now be shown. Draw a box around the area you want to crop and all the selected nodes will be highlighted. Press delete and your object will cropped. If it's a closed shape, you may need to move one or two of the remaining nodes to make it look right. -(WT-en) Shaund 11:48, 13 May 2012 (EDT)
I've been meaning to overhaul this article for a while, and will see if I can manage in the next two days. Specific answers/tips:
- Ctrl+Click will select individual paths/objects, even within groups (and everything comes in one big group with OSM).
- Ctrl+U ungroups, but ungrouping a huge muddle (original import) will drain memory, so it's good to reduce things first.
- Ctrl+Shift+PgUp / Ctrl+Shift+PgDown moves selection up and down through existing layers. So to move an import into a layer without pasting, just select and then use this shortcut.
- Cropping sucks in Inkscape. The fastest (i.e., least memory-intensive) method is to draw an object (like a rectangle) over the area you want to crop, and then use the difference tool by selecting the object on top and the target of the crop, then pressing Ctrl+-. Clipping is another option, but it's a bad one.
- Selecting giant quantities of nodes with shift+click+drag will devastate your PC's performance.
- Moving selections of a large number of complex objects through layers eats a ton of RAM--either group them or even better yet combine them (Ctrl+K) before hitting Ctrl+Shift+PgUp/PgDown.
- Finding the color code is actually really easy--just move the eye dropper (F7) over the color, and the color code will appear in the status bar at the bottom of the Inkscape window.
- After getting rid of the extraneous nodes from the overly large background objects (point 4), I usually aim to get all the small streets out of the way, since they have a huge number of nodes, which affects performance in a pretty extreme way. I find the most efficient method is to ctrl click a single little white street, then hit Ctrl+X to pull up the XML editor. Then copy the info under "style." Hit Ctrl+F to bring up the find box, and paste the style info into the style field, then hit enter. That should select all of the small white streets with the same style. Then hit Ctrl-K to combine them into one monster path. Wait for the combine to finish (and this often takes a while, unless you have a ton of RAM), then move the massive grid of small streets to a different, invisible layer. Having the small streets hidden in this manner, until you are ready to export or place listing icons precisely, will take a huge load off your memory.
Hope that is helpful, and I'll work on this article as soon as I can. --(WT-en) Peter Talk 17:09, 13 May 2012 (EDT)
Updates
I tried to update this article to give more concrete step-by-step instructions for dealing with OSM imports in Inkscape. Was this helpful? Are there other questions that should be answered in this article, or other ways to present needed information? --(WT-en) Peter Talk 23:37, 20 May 2012 (EDT)
- One Inkscape use-case that would help me would be a more detailed explanation of using the difference tool. The particular use-case that's driving me nuts is that I'd like to use a different color for different states in Image:Yellowstone-map.png. However, the imported state borders are all separate path objects, and if I combine them and then draw a rectangle over top, the difference tool yields a shape that fills erratically - some fill is inside of the shape, some is outside, and some is handled via lines that cross the new shape. I assume that this is a nuance of combining paths that I'm not understanding, but a bit more info on how others are using the difference tool might help to sort out exactly where the trouble lies. -- (WT-en) Ryan • (talk) • 23:57, 20 May 2012 (EDT)
- Ah, this is actually just a problem with OSM imports... The only way to deal with the sloppy purple OSM political border lines is tedious, and I've done it many times: ctrl+click and delete extraneous paths, and merge nodes to connect adjacent paths (by using F2 to look at the nodes, selecting two that occupy the same space, and then selecting combine nodes in the node selector tool's toolbar). Tracing your own path over the OSM borders is the other, less perfectionisty option. --(WT-en) Peter Talk 00:27, 21 May 2012 (EDT)
- Thanks - this was making me a bit nuts. I'll try to add some of my own notes to the "How to" article based on my own experiences after I've got a bit more map-making experience. -- (WT-en) Ryan • (talk) • 01:30, 21 May 2012 (EDT)